Histogram Plot
To plot Histograms of results after a Probabilistic Analysis:
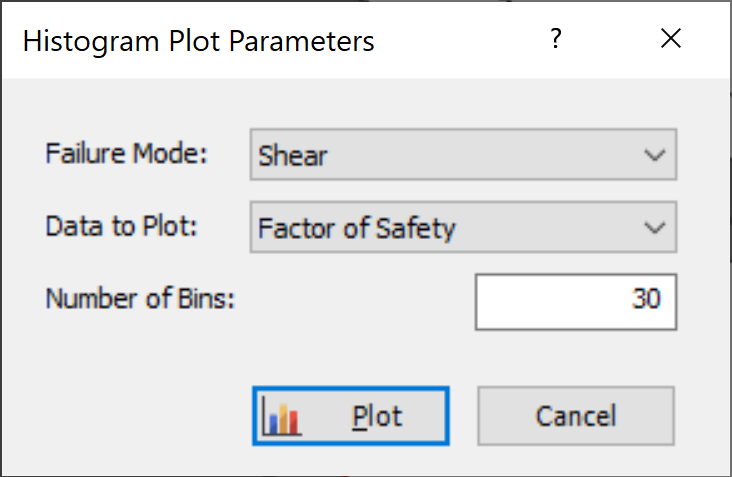
- Select Plot Histogram
 from the toolbar or Statistics menu.
 - Select the Failure Mode (e.g. Shear, Elastic Buckling, Arch Snap Thru, or Compression, whichever is applicable).
- Select the Data to Plot (e.g. Factor of Safety, or one of your input data random variables).
- Enter a Number of Bins. The default is 30, but any value between 2 and 100 can be entered.
- Click Plot.
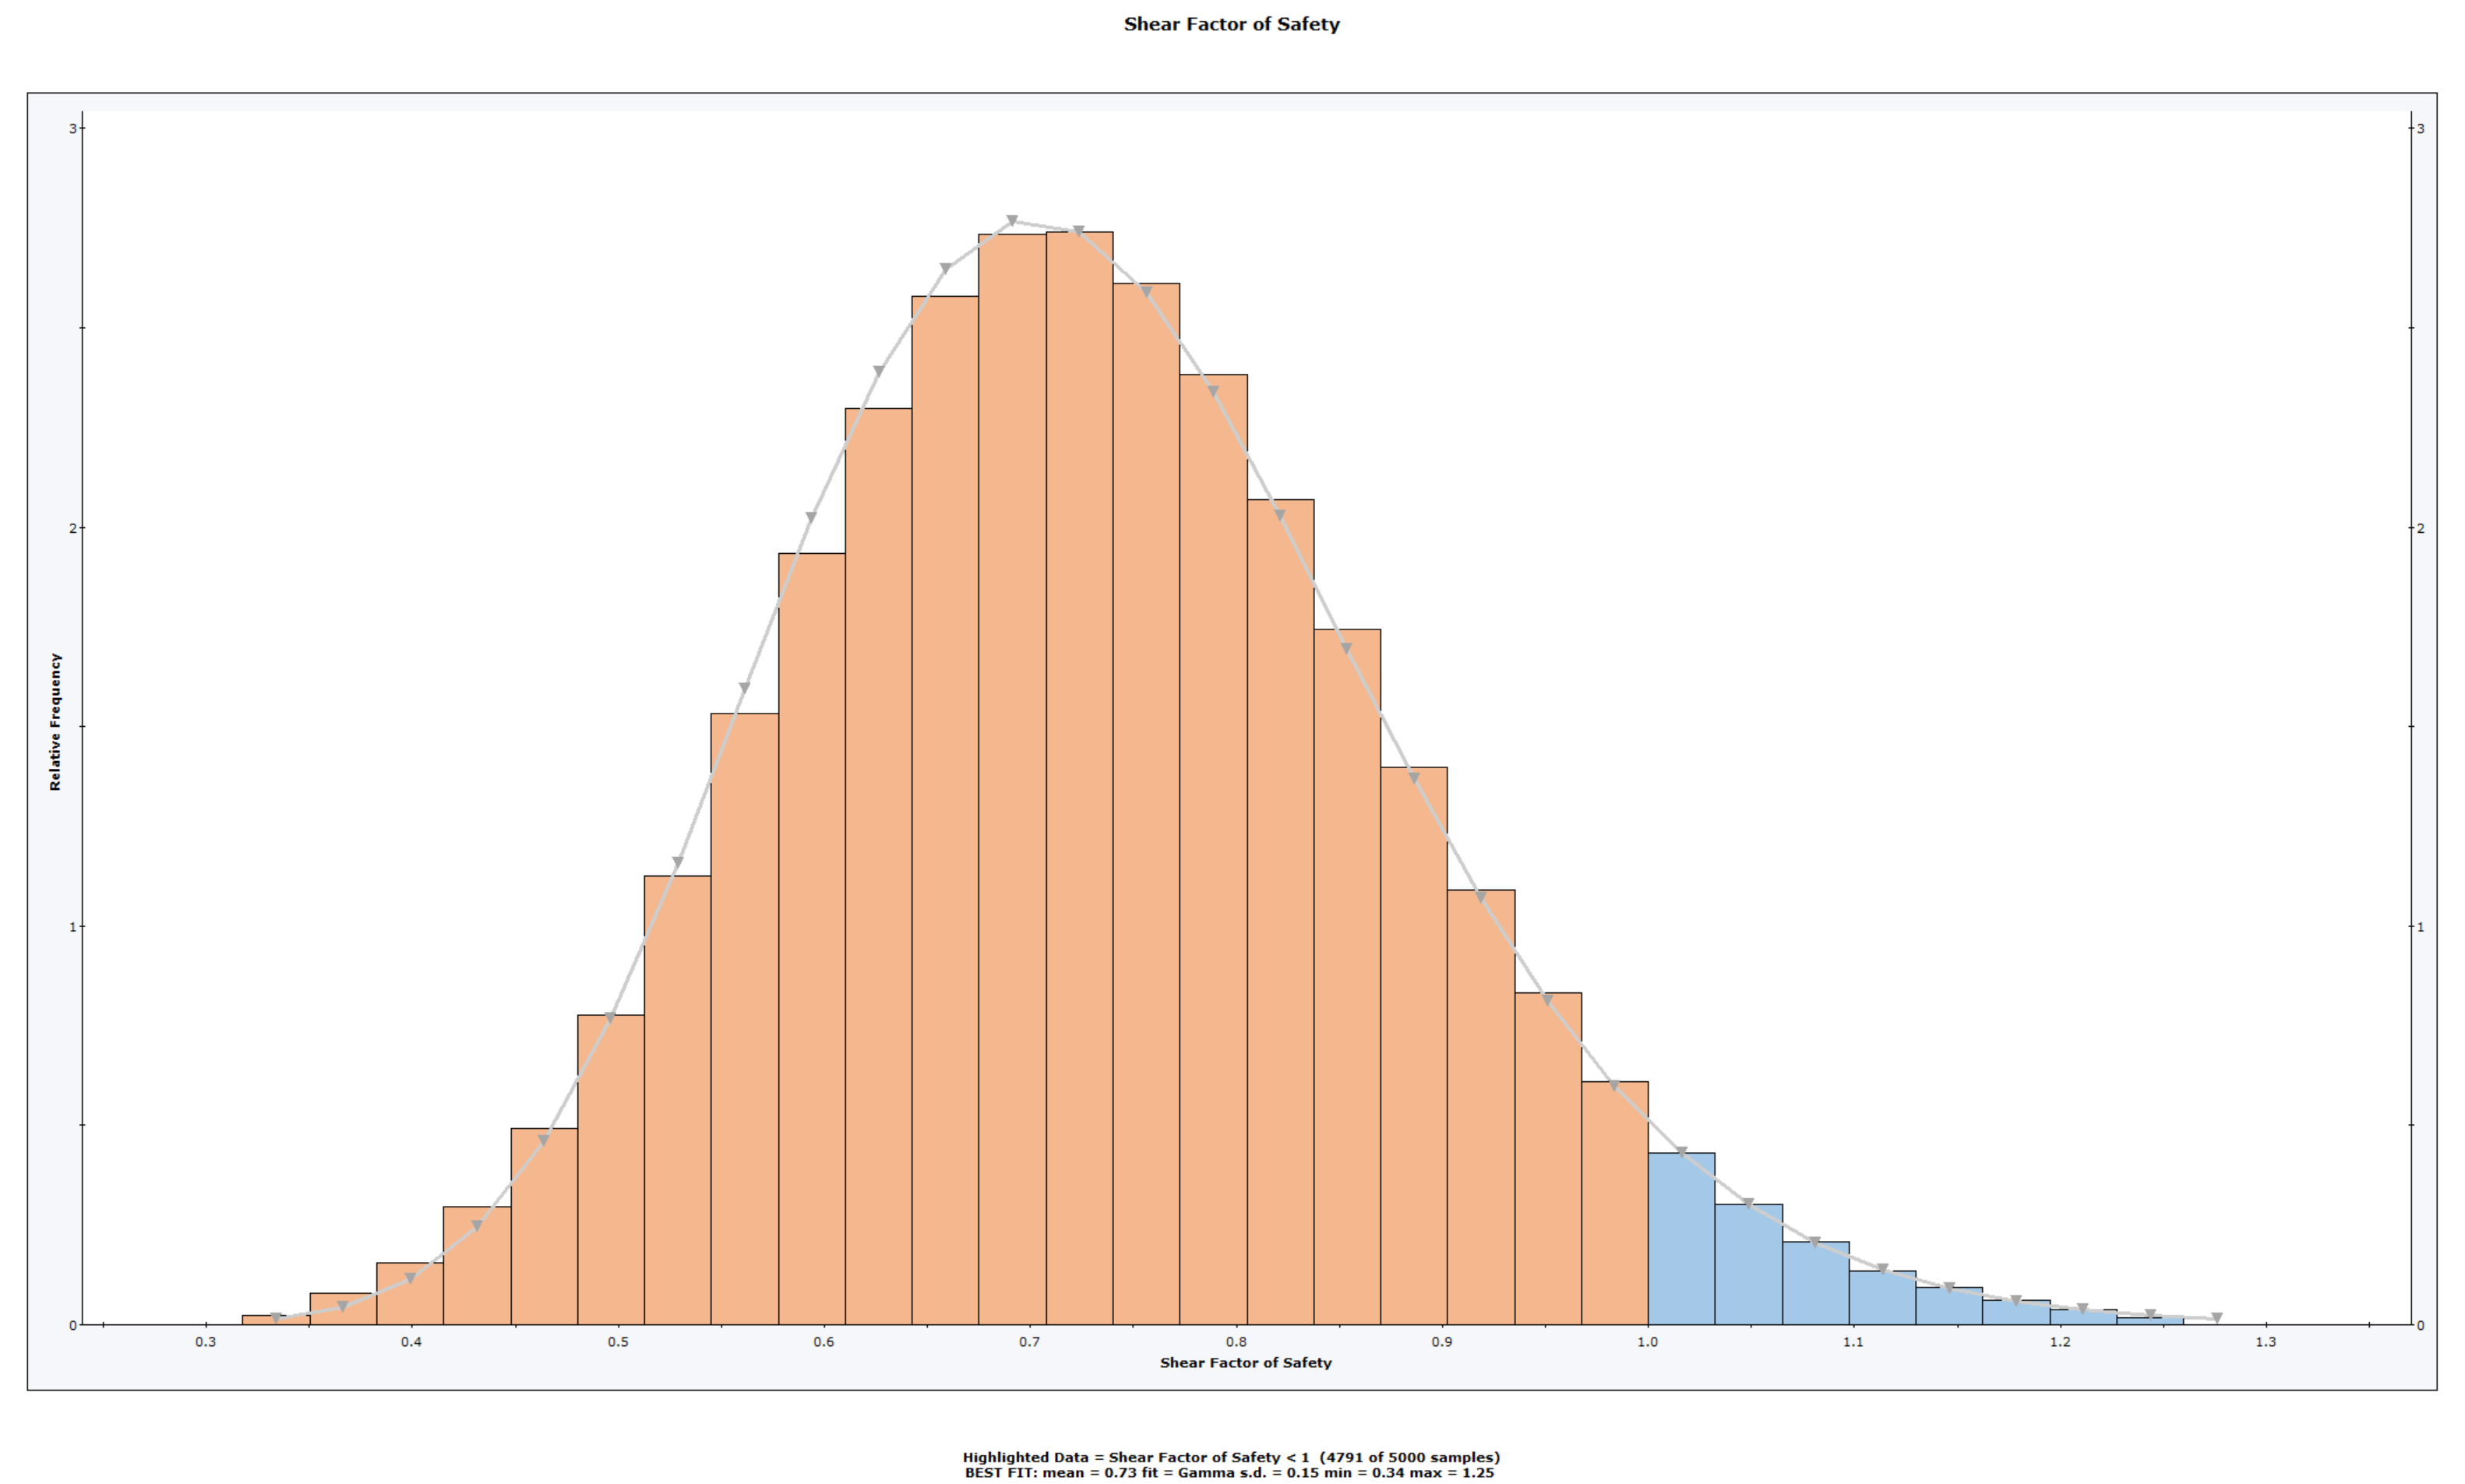
The Histogram will be generated, and the mean, standard deviation, minimum and maximum values for the data plotted, will be listed at the bottom of the Histogram.
Right-Click Options
Several options are available in the right-click menu for Histograms, including: