Histogram
To plot a Histogram for either a Probabilistic or Deterministic Analysis in RocSlope2:
- Select Results > Charts > Histogram

- Select an Analysis Type (Wedge, Planar, or Toppling) from the first drop-down list in the dialog.
- Select the Data to Plot from the second drop-down list in the dialog.
- You can choose to highlight data on the plot according to user-defined criteria by selecting the Highlight Data checkbox and defining your criteria. See below for details on other options.
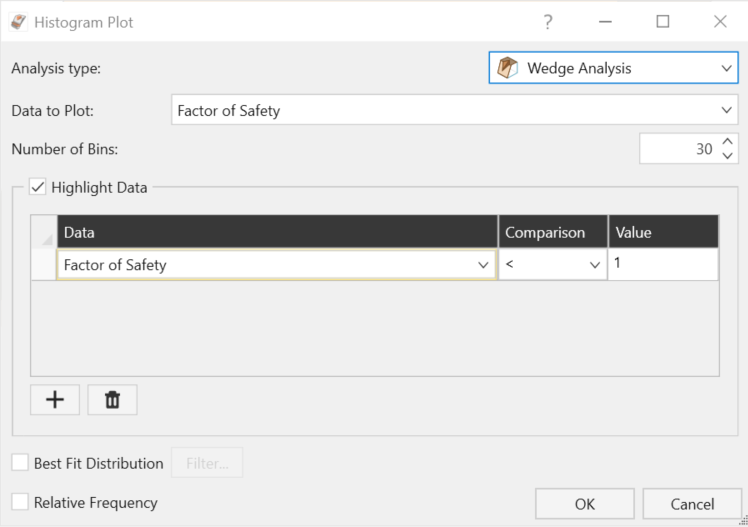
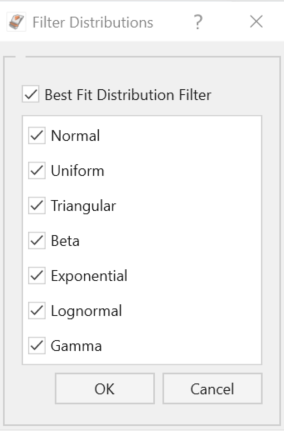
- Select the Best Fit Distribution checkbox to plot the best fit curve on top of the histogram according to one of distributions. The distributions can be filtered by selecting Filter... and disabling any unwanted distributions in the Filter Distributions dialog.
- Select the Relative Frequency checkbox to get the relative frequency of the histogram.
- Click OK.
The Histogram is generated, and the following values for the plotted data are listed at the bottom of the Histogram:
- SAMPLED: the calculated statistics of the raw computed data generated by the Probabilistic Analysis.
- FIT: the statistics of the BEST FIT distribution, to the raw data. The type of distribution, and the parameters of the distribution, which best fits the actual distribution of the raw computed data, is listed. In most cases, the statistics of the FIT distribution will be identical to the statistics of the raw data.
The FIT information will only be listed if the Best Fit Distribution is displayed on the histogram.
Highlight Data
To highlight any subset of data on the histogram:
- Select Chart > Chart Options > Highlight Data

- Select a Data variable from the drop-down list.
- Select an operator (<, <=, >, >=, Range).
- Enter the numerical value(s) defining the data you would like to see highlighted.
- When you select the Plot button, data which fits your selection criteria will be highlighted on the histogram in a different color with a legend. The highlight criterion will be listed at the top of the histogram. Highlight colors can be adjusted in the Chart Palette.
Chart Data
The following functionality is available in the Chart Data tools:
- Change Data
 prompts the Histogram Plot dialog to appear, allowing you to change the data viewed on the plot.
 - Chart in Excel
 prompts an Excel application to open with exported data in columns. A chart object duplicating the chart in RocSlope2 will also appear.
 - Copy Data
 allows you to copy and paste the data to another spreadsheet or word file.
Chart Options
The Chart Options tools in the menu bar contains a variety of options for adjusting the appearance of the Histogram:
- Relative Frequency
 toggles the relative frequency charting on/off.
 - Highlight Data toggles the data highlights on/off
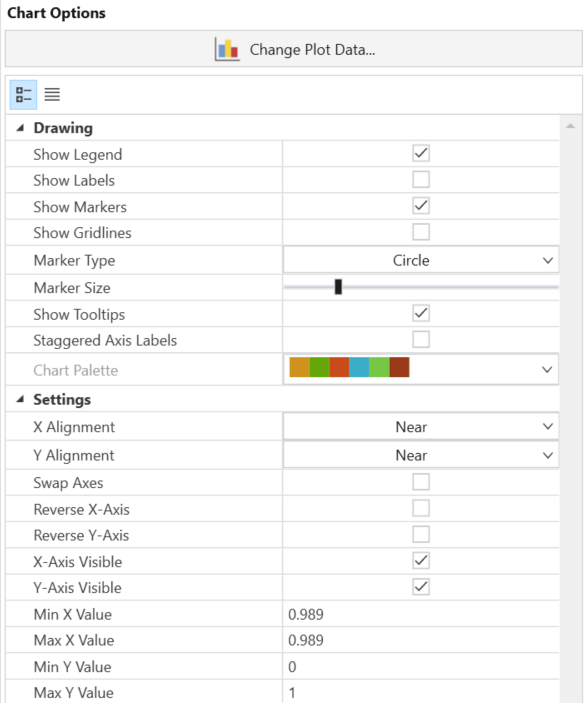
The Chart Options pane on the left side allows you to modify the graph via the drawing/settings. The drawing options allow you to change labels, while settings allow you to adjust the graph settings such as axis alignment, min/max, etc.
Right-Click Options
Many different options are available if you right-click on a Histogram. For example:
- Select the Change Plot Data option, and the Histogram Plot dialog will appear, allowing you to change the data viewed on the plot.
- Plot in Excel : you can either right-click a chart or click the Chart in Excel button in the toolbar. An Excel application will open, and the data will be exported in columns. A chart object duplicating the chart in RocSlope2 will also appear.
- Copy Chart Image
 : this allows you to copy and paste the chart as an image.
 - Copy Data to Clipboard : this allows you to copy and paste the data to another spreadsheet or word file