Contour Options
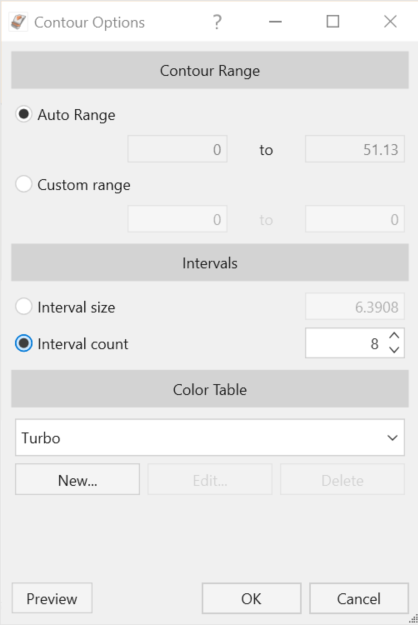
The Contour Options dialog allows the user to adjust the range and color format of the displayed contours for their results.
To access the Contour Options:
- Select Results > Contours > Contour Options

- Set Contour Range, Intervals and Color Table.
- Select OK to close the dialog.
Contour Legend
To access the Contour Legend:
- Select Results > Contours > Show Water Contours

- This will open the Contour Legend, located in the Legend panel to the right of the Results Grid.
To learn more about the Contour Legend, see Legend.
Contour Range
- Auto Range: Automatically sets the range to the min and max contour values (the values can't be edited).
- Custom Range: Allows you to define the range of contour with the user-defined value.
Intervals
- Interval Size: You can define the interval range of contour to be displayed.
- Interval Count: You can define the number of intervals of contour range to be displayed in the model.
Color Table
RocSlope2 offers users a variety of preset contour color options. Use the drop-down menu to select one of the below color maps, then click Ok. The chosen color map can be previewed by selecting the Preview button.
- Hot to Cold
- Cold to Hot
- Turbo
- Viridis
- Magma
- Plasma
- Cividis
- Batlow
The Turbo option provides smoother and more visually accurate contours for representing the data, as well as an option that is more distinguishable to our eyes. More explanation on improved rainbow color map for visualization is provided here.
To select a new Color Table:
- Select Results > Contours > Contour Options
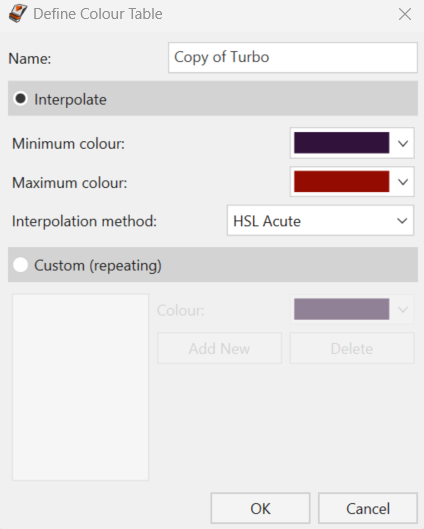
- Select New under the Color Table settings. This will open the Define Color Table dialog.
- Enter Name to label the new table.
- Select either Interpolate or Custom for the color option.
- Select OK when adjustments are complete to apply the new color table.