1 - Quick Start
1.0 Introduction
This tutorial is a simple introductory tutorial that helps you become familiar with the basic modelling and data interpretation features of RocSlope2.
An essential part of your rock slope analysis toolkit, RocSlope2 allows you to quickly identify and analyze the critical mode of structural failure. RocSlope2 is an easy-to-use software where users can perform entire kinematic analysis of wedge, planar and toppling analysis in one day to obtain Factors of Safety and Probability of Failures determined through limit-equilibrium analyses. RocSlope2's direct integration with the Rocscience Dips software enables a smooth extension from kinematic analysis in Dips to a full equilibrium analysis in RocSlope2.
Topics Covered in this Tutorial:
- Project Settings
- Deterministic Analysis
- Input Data
- Slope Geometry
- Joint Orientations & Properties
- Viewing Options
- Analysis Results
Finished Product:
The finished product of this tutorial can be found in Tutorial 1 Quick Start.rocslope2 file, located in the Examples > Tutorials folder in your RocSlope2 installation folder.
2.0 Creating a New File
- If you have not already done so, run the RocSlope2 program by double-clicking the RocSlope2 icon in your installation folder by selecting Programs > Rocscience > RocSlope2 in the Windows Start menu.When the program starts, a default model is automatically created. If you do NOT see a model on your screen, proceed with the following instructions.
- Select File > New Project

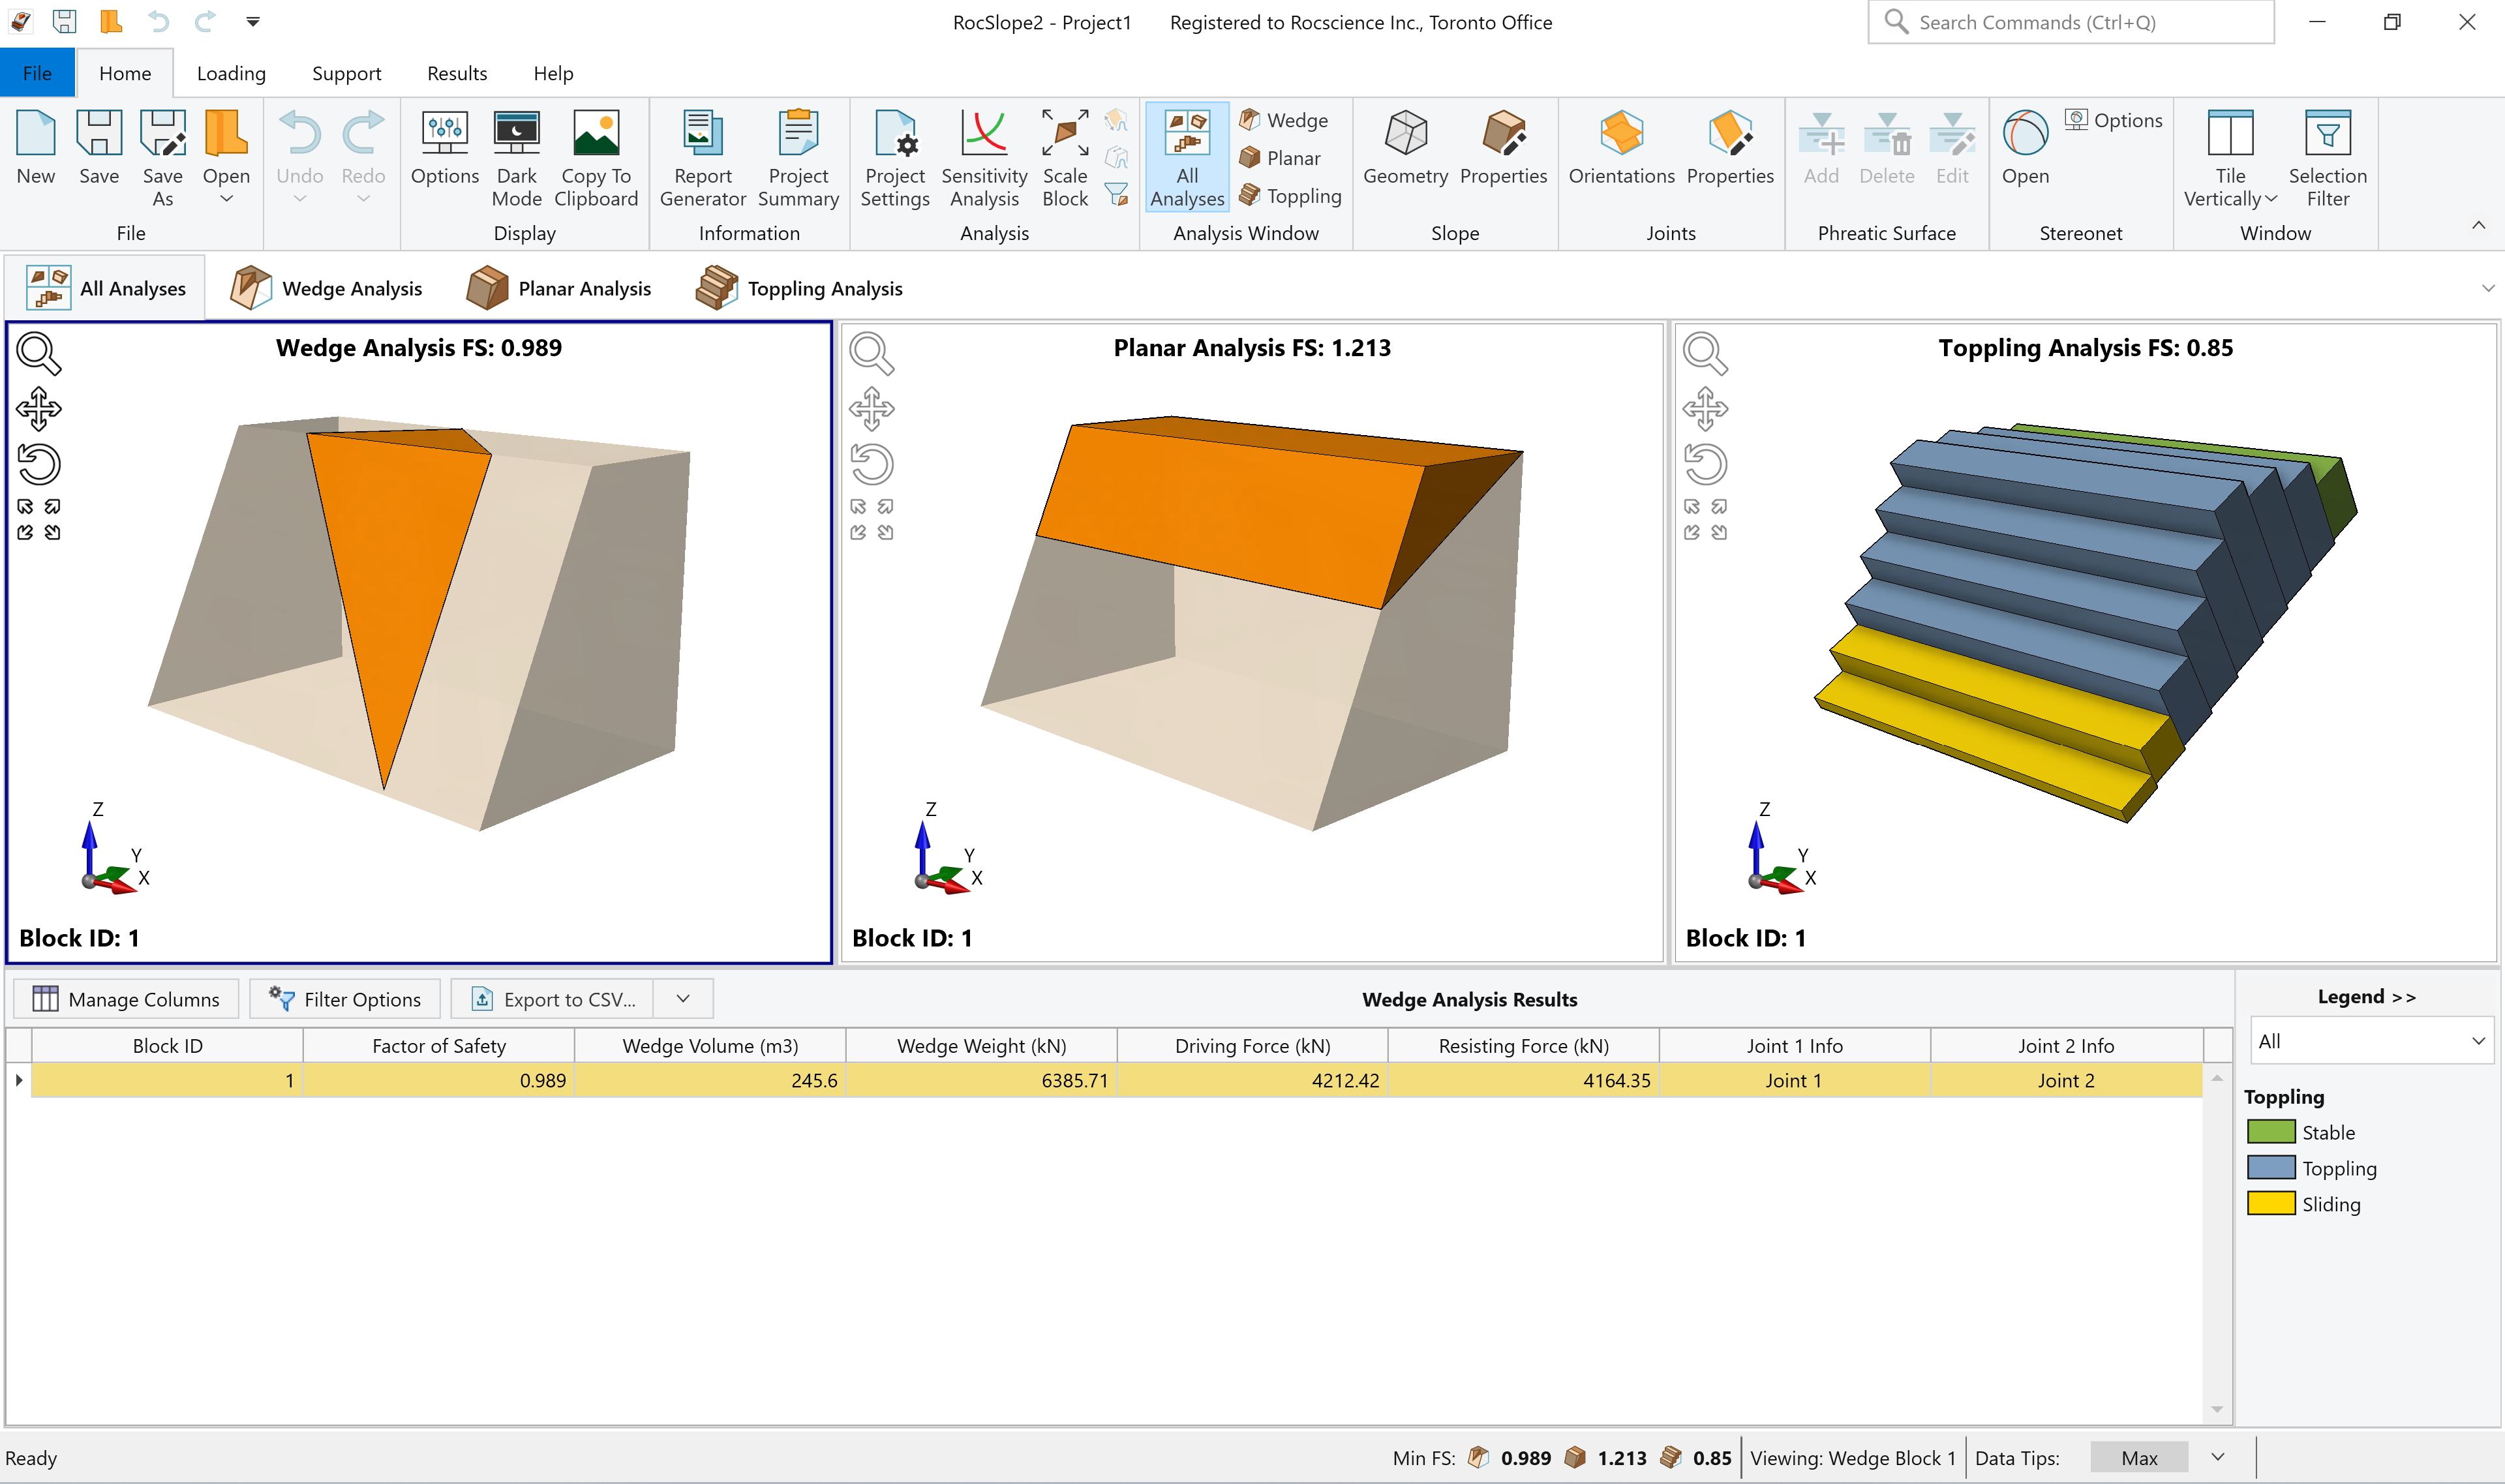
Whenever a new file is created, the default input data forms valid slope geometrics for wedge, planar and toppling analysis, as shown in the image below.
If the RocSlope2 application window is not already maximized, maximize it now so that the full screen is available for viewing the model.
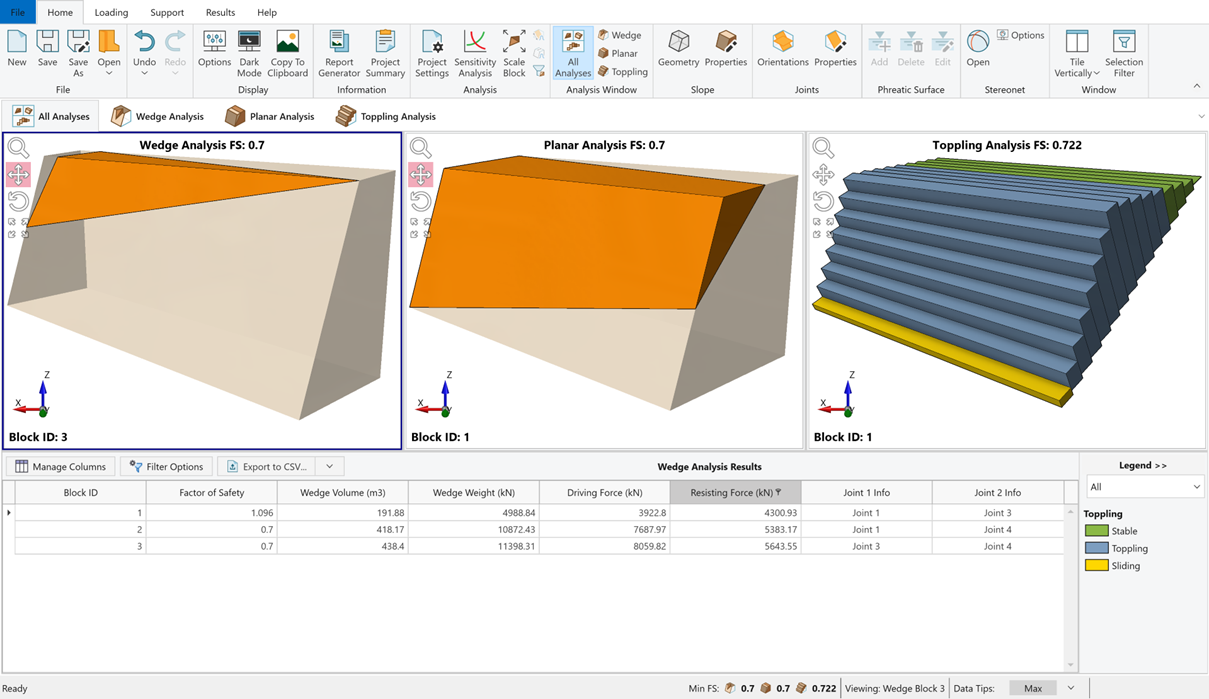
Notice the four-pane, split-screen format of the display, which shows Wedge, Planar and Toppling analysis as well as the results grid pane.
3.0 Project Settings
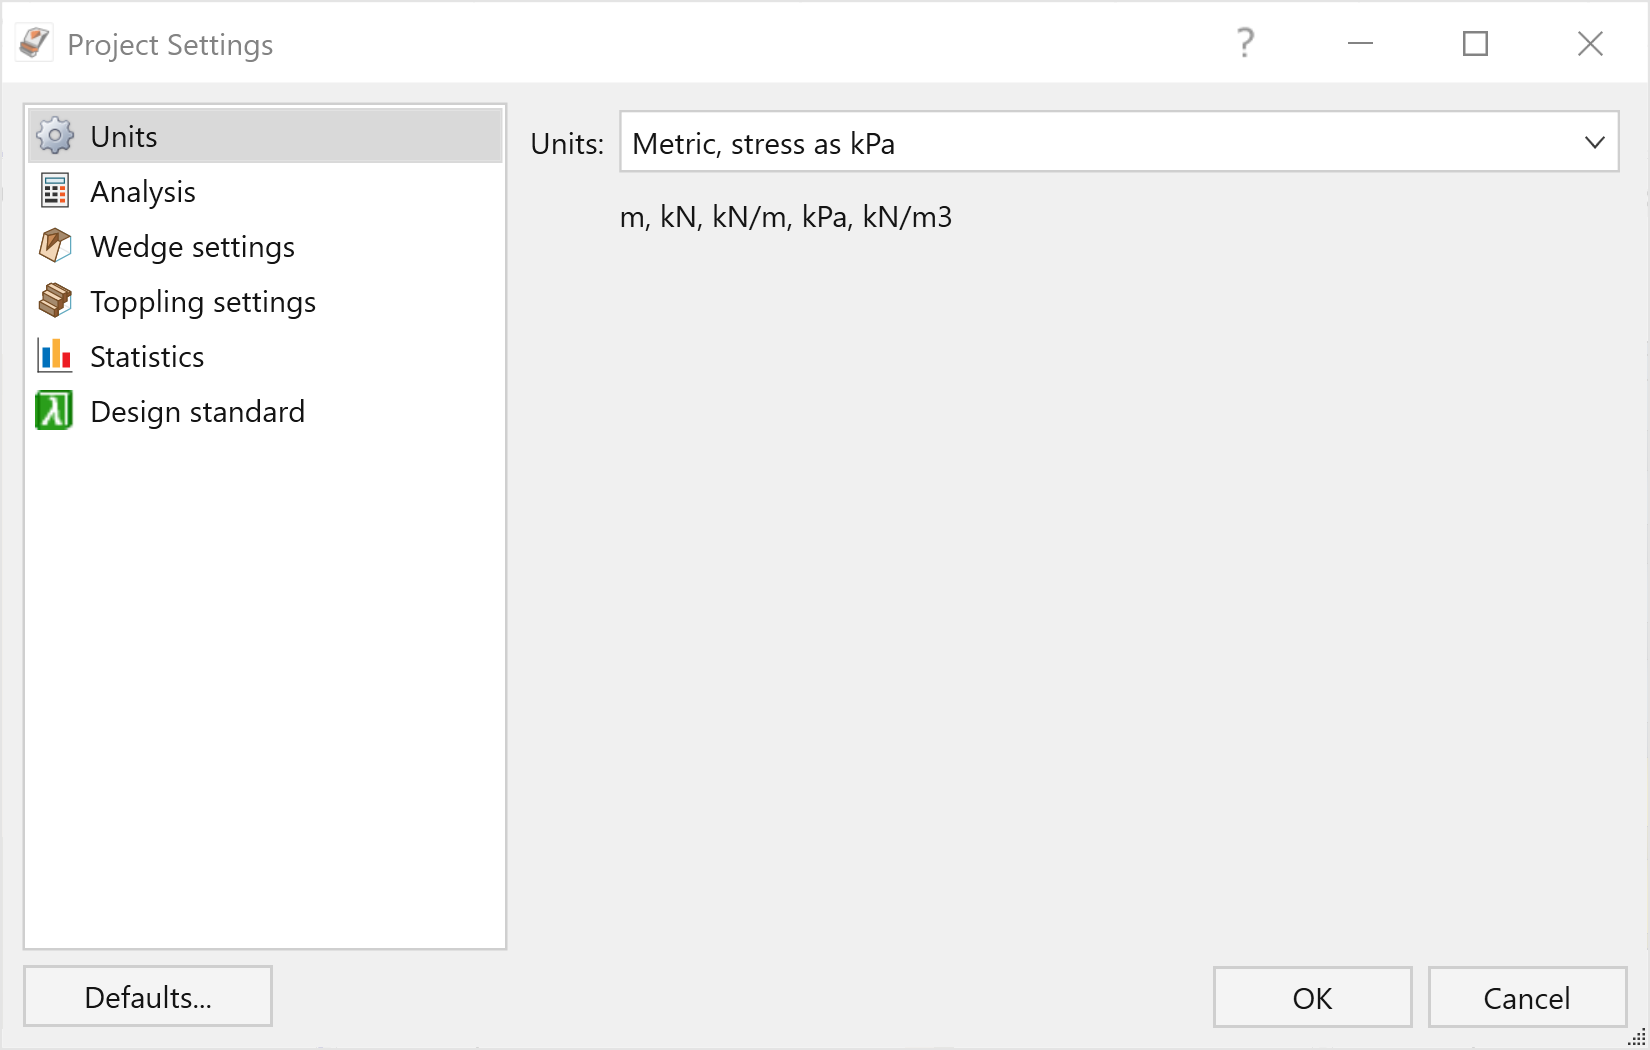
The Project Settings dialog allows you to configure the main analysis parameters for your model, such as Analysis Method, Analysis Type and Units. To open the dialog:
- Select Home > Analysis > Project Settings
 on the toolbar.
3.1 Analysis Method
There are three main analysis methods in RocSlope2: Wedge, Planar and Toppling. All analysis methods are enabled by default and can be enabled/disabled depending on the desired failure mode analysis to be performed.
In this tutorial we will perform analysis for all three failure modes of wedge, planar and toppling.
- Wedge method is used to evaluate the stability of surface wedges in rock slopes defined by two (or three) intersecting discontinuity planes, the slope surface, and an optional tension crack.
- Planar method is used to assess the stability of planar sliding blocks/wedges in rock slopes while sliding occurs on a plane that strikes approximately parallel to the strike of the slope face.
- Toppling method is used to perform stability analysis of toppling block which is based on the popular limit equilibrium block toppling method of Goodman and Bray first published in 1976 in the paper, Toppling of Rock Slopes, and the block flexure toppling method of Amini, Majdi and Veshadi published in 2012 in the paper, Stability Analysis of Rock Slopes Against Block-Flexure Toppling Failure.
3.2 Analysis Type
There are two main analysis types in RocSlope2: Deterministic and Probabilistic. Deterministic is the default analysis type.
- A Deterministic analysis assumes that all input parameters are exactly known. RocSlope2 computes the Factor of Safety (FS) for a single set of input data for enabled analysis methods of wedge, planar and/or toppling failure. This tutorial demonstrates a Deterministic analysis.
- For a Probabilistic analysis, statistical input data can be entered to account for uncertainty in input data such as slope geometry, joint orientation, strength values, etc. The result is a distribution of Factors of Safety, from which a Probability of Failure is calculated. Probabilistic analysis is demonstrated in Tutorial 05 - Sensitivity & Probabilistic Analysis in RocSlope2.
3.3 Units
The Units setting determines the length and force units used in the analysis. In this tutorial we are using metric kPa units.
- Ensure that the Units are Metric, stress as kPa in the Units tab in Project Settings (the default setting).
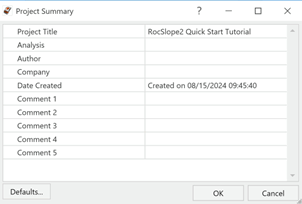
3.4 Project Summary
- Select Home > Information > Project Summary
 toolbar.
 - Enter RocSlope2 Quick Start Tutorial as the Project Title.
4.0 Input Data
Slope Geometry, Slope Properties, Joint Orientation and Joint Properties are the four main input data where data is entered through each corresponding menu.
4.1 Slope Geometry
Slope Geometry is the input data dialog for entering slope geometry data in RocSlope2.
- Select Home > Slope > Geometry

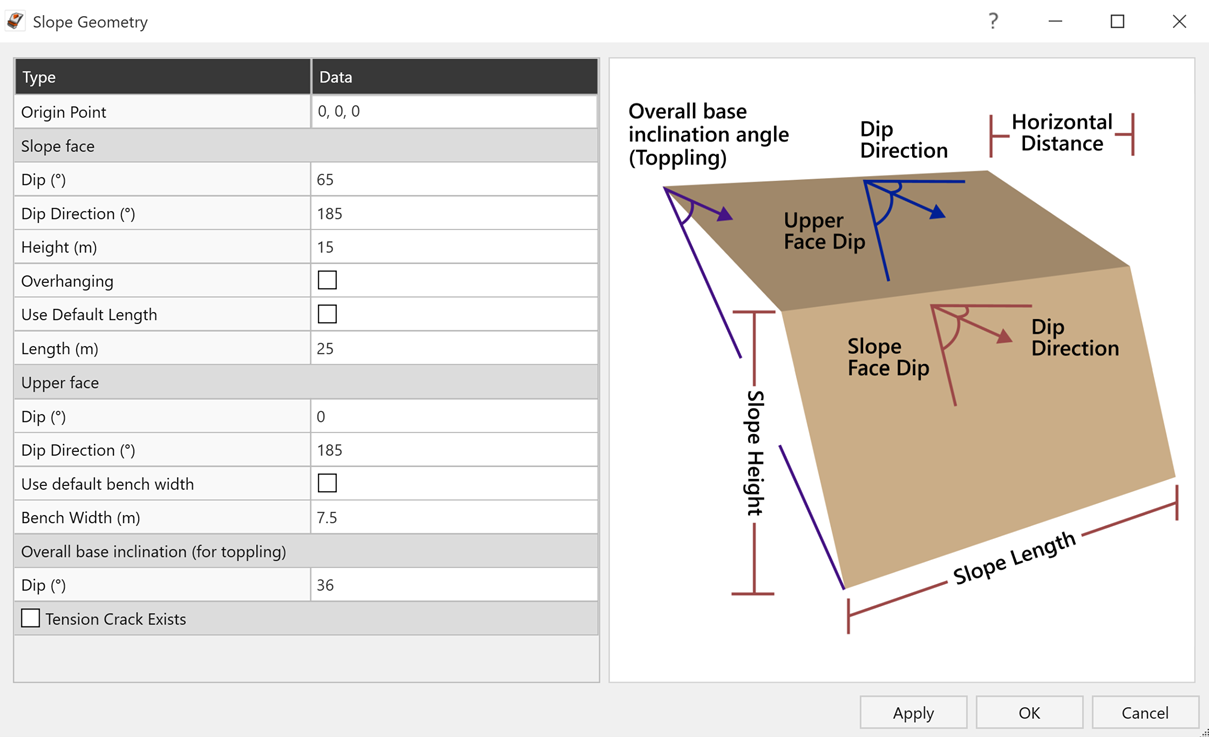
Deterministic Slope Geometry Input Data Dialog - Examine the Slope input data. The Slope face Orientation (Dip, Dip Direction), Height, Upper face Orientation (Dip, Direction) are required for wedge and planar analysis. Overall base inclination (Dip, Dip Direction) is also required for toppling analysis. All other Slope Geometry input data is optional.
- Change the Slope Geometry input data using the following data:
Slope Face Dip (º) 70 Slope Face Dip Direction (º) 45 Height (m) 20 Slope Face Length (m)
50 Upper Face Dip (º)
5 Upper Face Dip Direction (º) 45 Overall Base Inclination/Dip (º) 42 - Enable Use Default Bench Width by click on the checkbox next to it.
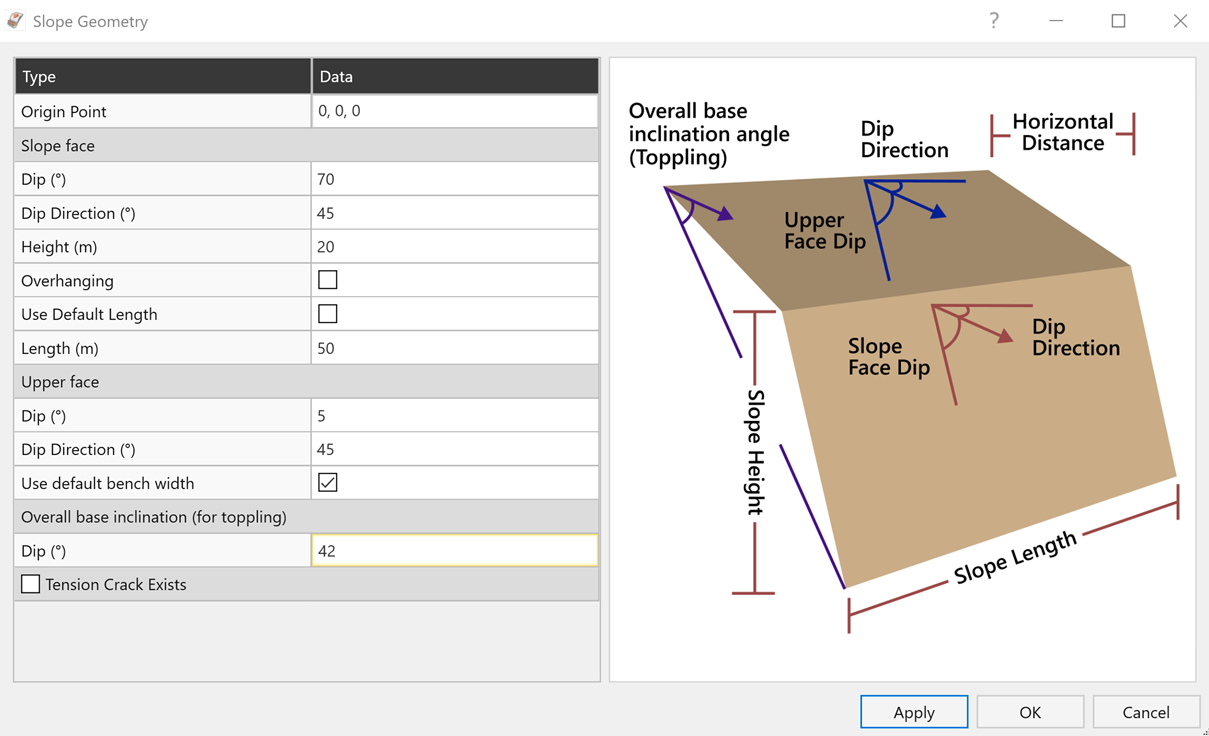
- Press OK to close the dialog.
4.2 Slope Properties
Slope Properties is the input data dialog for entering the data for Rock Unit Weight, Water Parameters and Rock Material Strength if the Block Flexure Toppling is enabled.
- Select Home > Slope > Properties

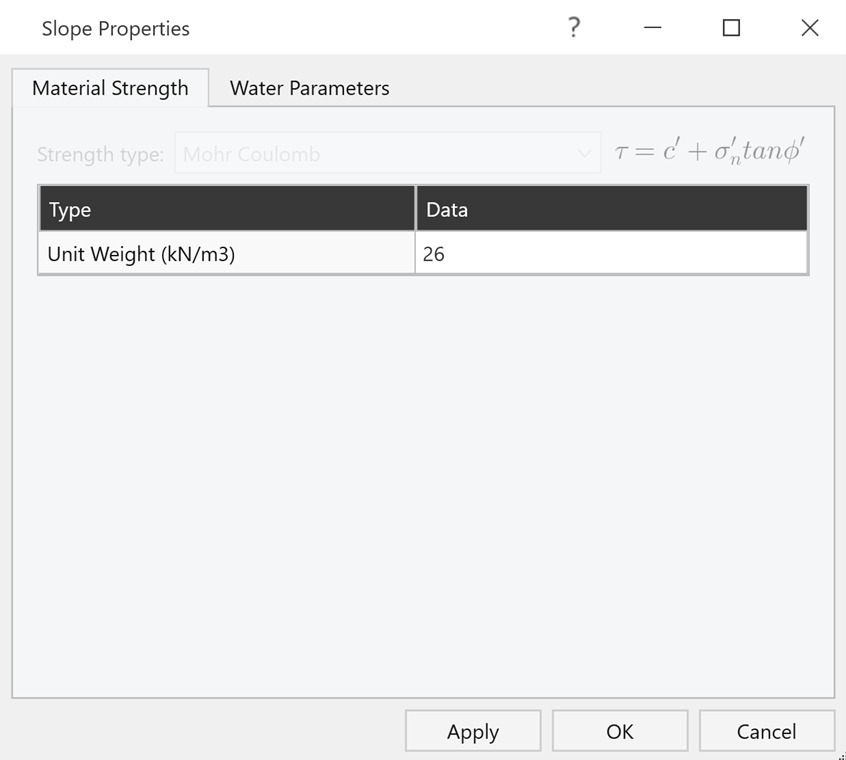
Deterministic Slope Properties Input Data dialog - Examine the Slope Properties input data. Rock Unit Weight is required while all other Slope Properties input data is optional.
- Leave the Slope Properties data as is since we will proceed with default data and click OK.
4.3 Joint Orientations
Joint Orientations is the input data dialog to define the Joint Orientations (Dip, Direction), assign Joint Property to each joint, define Joint Spacing for toppling analysis, and set Lateral Limits for sliding and toppling joints if desired.
- Select Home > Joints > Orientations

- Examine the Joint Orientation input data.
- Change the Joint Spacing under Toppling Analysis Settings to 2.
- Set Base Joint Property to Joint Property 2.
- Edit the Joint Orientation input data using the following data:
Joint No Dip (°) Dip Direction (°) Joint Property 1 70 14 Joint Property 1 2
65 220 Joint Property 1 3
74 145 Joint Property 1 4
45 52 Joint Property 1 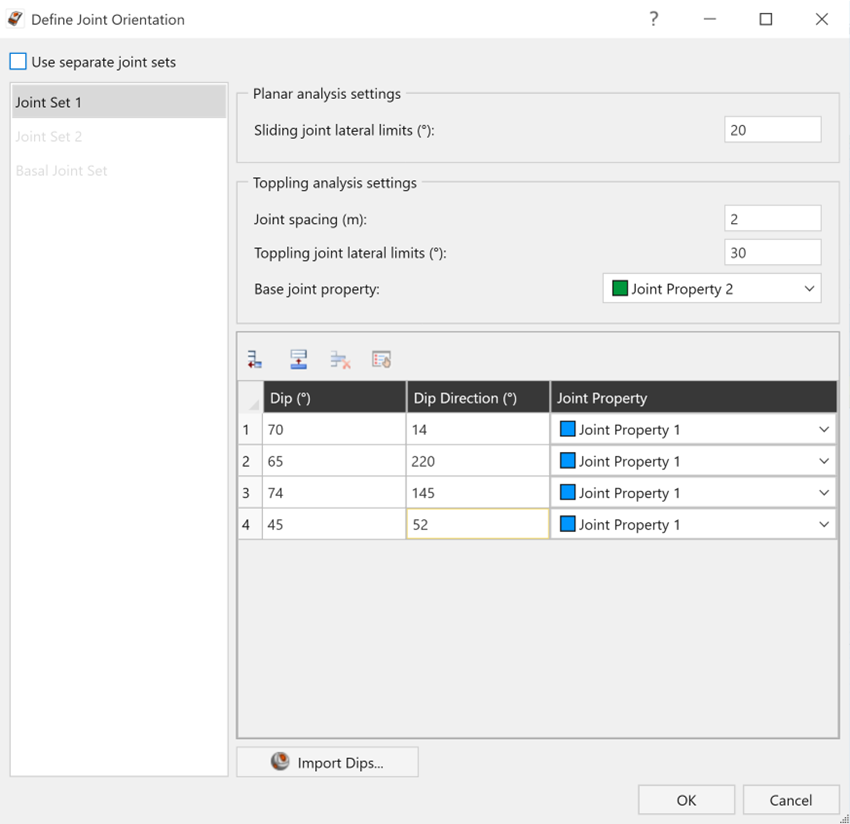
Deterministic Joint Orientation Input Data dialog - Ensure the Sliding and Toppling lateral limits are as follows:
- Sliding Joint Lateral Limits = 20º
- Toppling Joint Lateral Limits = 30º
- Click OK to close the dialog.
4.4 Joint Properties
Joint Properties is the input data dialog to define the Joint Strength (Strength Type and Parameters) and Water Parameters (Pressure Distribution Model and Data).
- Select Home > Joints > Properties

- Ensure the Joint Property 1 data as follows:
- Cohesion (kPa) = 0
- Phi (º) = 35
- Waviness (º) = 0
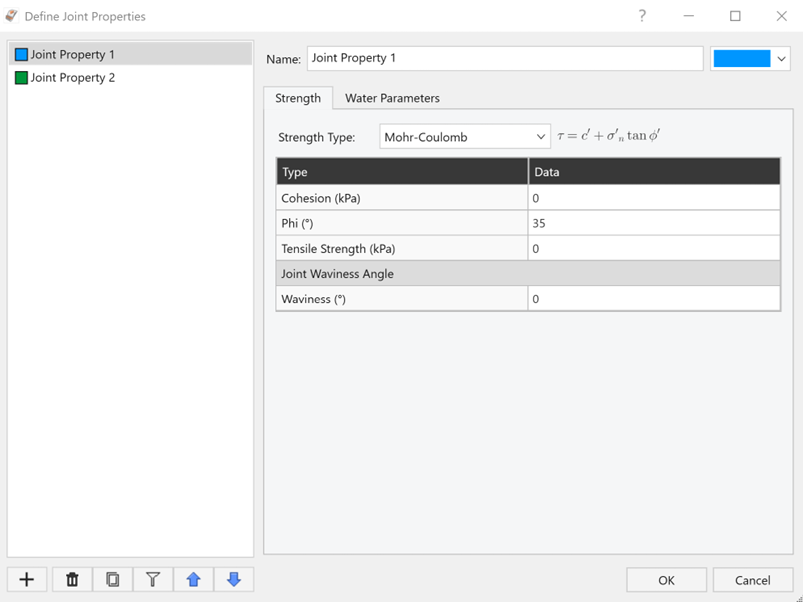
Deterministic Joint Properties Input Data dialog – Joint Property 1 - Select Joint Property 2 and enter the following data:
- Cohesion (kPa) = 5
- Phi (º) = 32
- Waviness (º) = 2
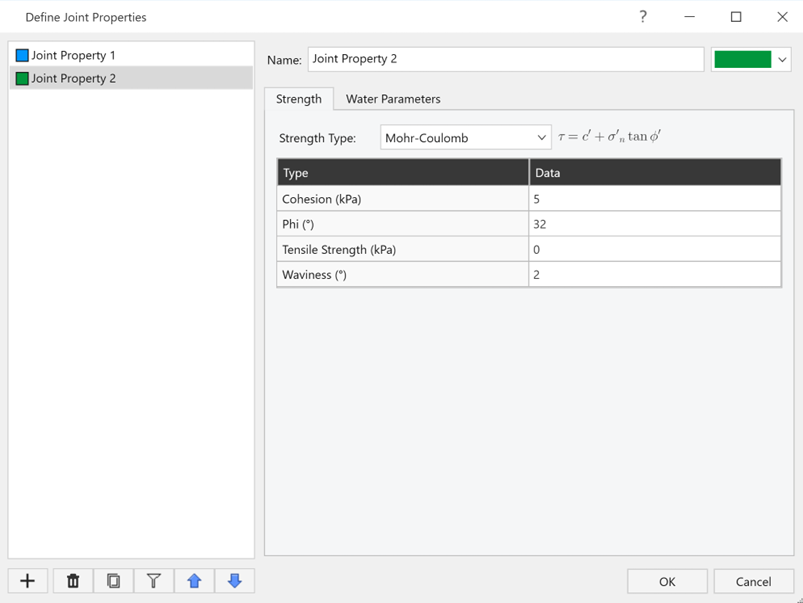
Deterministic Joint Properties Input Data dialog – Joint Property 2 The Waviness angle accounts for the waviness (undulations) of a joint surface, observed over distances on the order of 1m to 10m. It has the effect of increasing the shear strength of the joint. For more help on this input property, see Joint Waviness Angle. - Click OK to close the dialog.
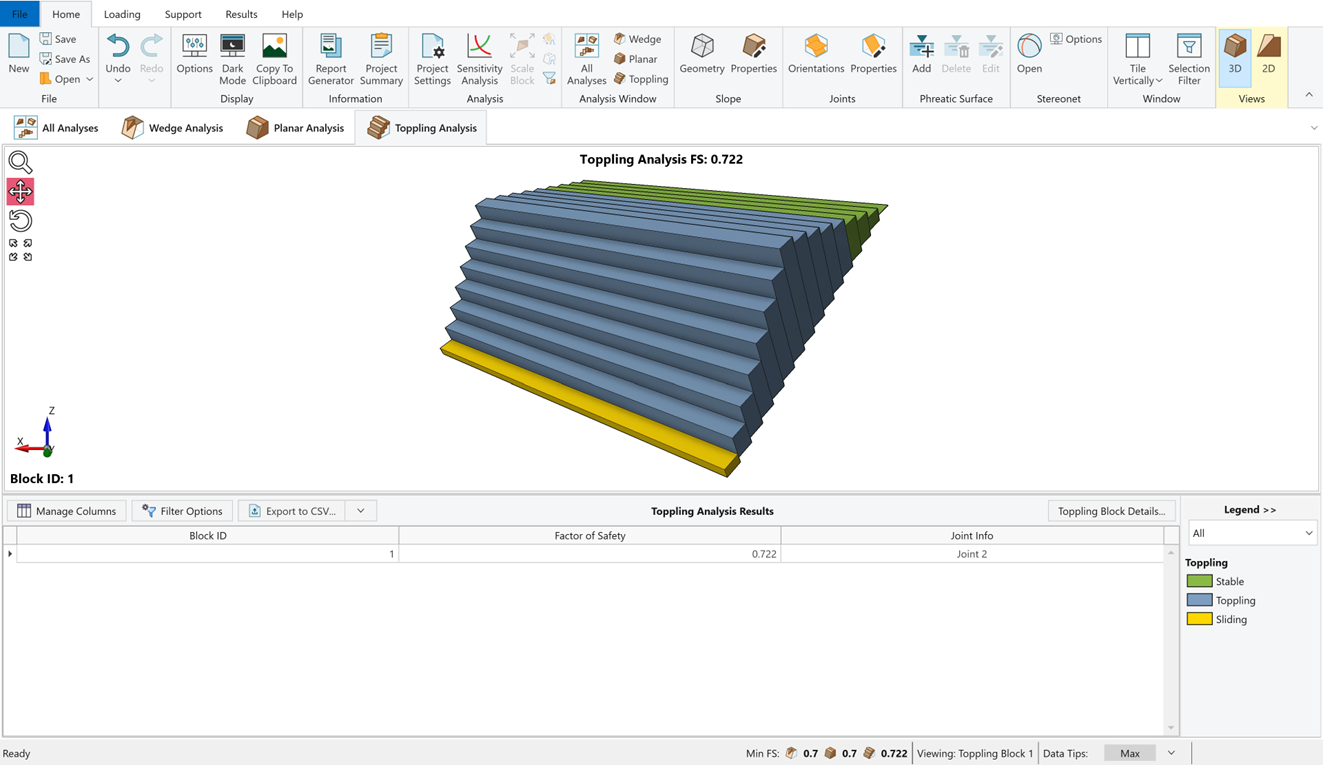
Notice that the Factor of Safety (FS) for Wedge, Planar and Toppling Analyses are computed instantly. You should see the Wedge Analysis with a Factor of Safety of 0.7, Planar Analysis with a Factor of Safety of 0.7 and Toppling Analysis with a Factor of Safety of 0.722.
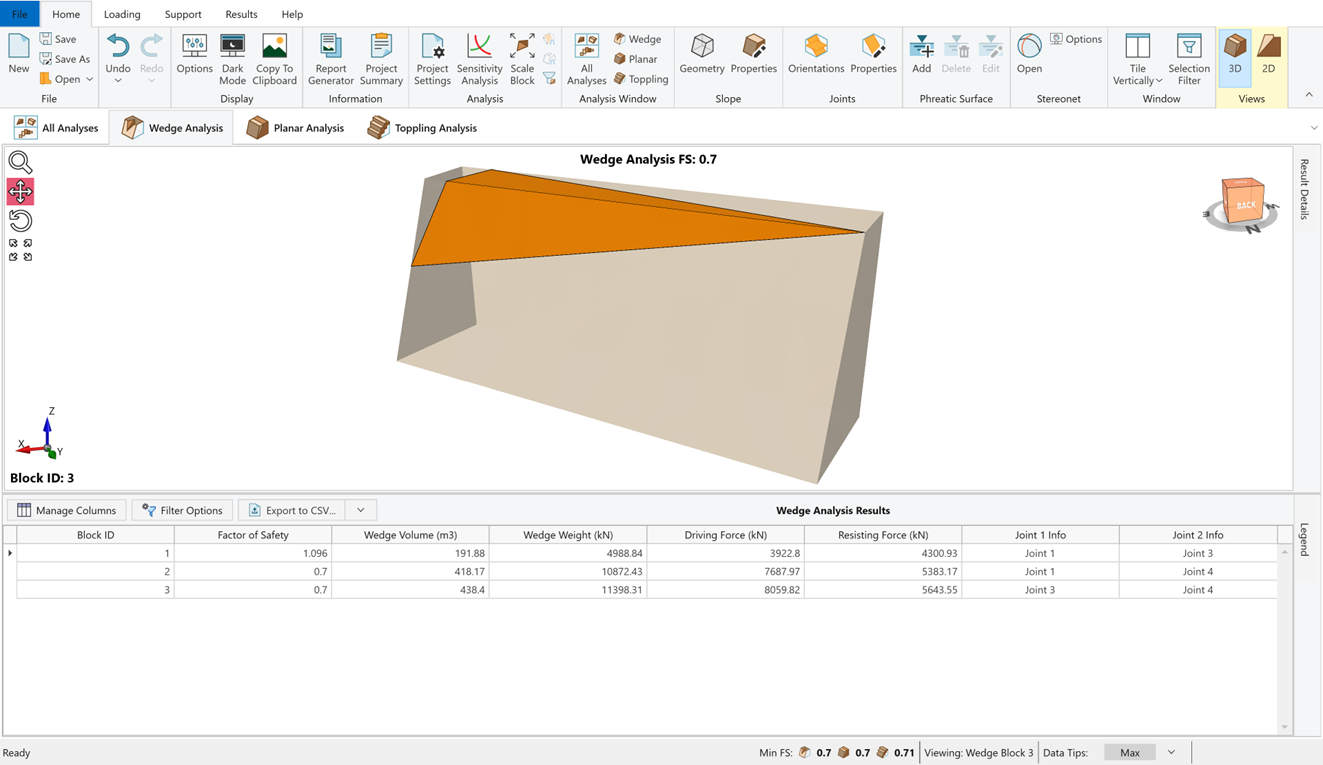
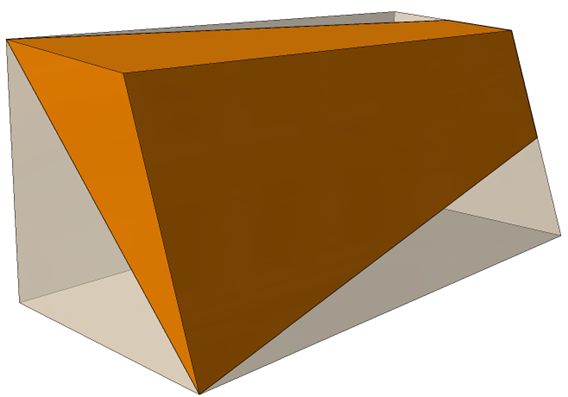
5.0 3D Wedge View
The default display in RocSlope2 is the split-screen format of the results for enabled analysis methods with the results grid pane below them at the bottom of the screen.
The 3D Wedge View is displayed when double-click on the Wedge Analysis pane or click on the Wedge Analysis  icon located on the toolbar.
While in the 3D Wedge View, you can use the mouse buttons to interactively manipulate the view as follows:
- Rotate for viewing at any angle with the left mouse button (or the mouse wheel).
- Move the wedge out of the slope with the left mouse button.
5.1 Rotating the Model
- Click on the Rotate View
 icon, or press and hold the mouse wheel anywhere off the model in the 3D Wedge View. The cursor changes to a circular arrow symbol to indicate that you can rotate the model.
 - Keep the left mouse button (or the mouse wheel) pressed and move the cursor around. The model is rotated according to the direction of movement of the cursor.
- To exit the rotation mode, click on the Rotate View icon again or release the mouse wheel. The cursor reverts to the normal arrow.
- Repeat the above steps to rotate the model for viewing at any angle.
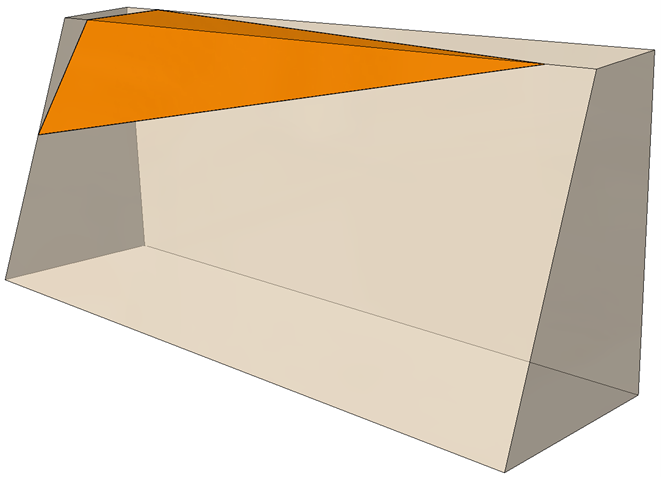
5.2 Moving the Wedge
The wedge can be moved out of the slope by clicking and dragging with the left mouse button as described below.
To move the wedge with the left mouse button:
- Position the cursor over the wedge in the 3D Wedge View. The cursor will change to a vertical, two-way arrow symbol.
- Click and hold the left mouse button and drag the mouse. As you move the cursor down, the wedge will slide out of the slope along the direction of sliding.
- If your model does NOT have a Tension Crack, the wedge slides along the Failure Plane.
- If your model has a Tension Crack, the wedge slides down along the Failure Plane, and up along the Tension Crack.
To reset the wedge to its default position within the slope:
- Right-click the mouse anywhere off the model in the 3D Wedge View and select Reset Block Translation.
5.3 Zooming and Panning
The following zoom and pan options are available in the 3D Wedge View.
- Zoom View
 - Zoom in and out within the view.
 - Pan View
 - Translate the model left, right, up or down within the view.
 - Rotate View - Rotate the model 360.
- Zoom Fit
 - Resize the model to fit the screen.
To restore the split-screen view in RocSlope2, double-click on anywhere off the model in the 3D Wedge View or click on All Analyses icon.
6.0 2D Wedge View
The 2D Wedge View in RocSlope2 allows you to display a two-dimensional view of your model. The view displays model lengths. To display the 2D Wedge View:
- Select 2D View
 on the Views toolbar.
2D Wedge View can be displayed individually by turning off the 3D Wedge View by clicking the 3D View  icon after enabling the 2D Wedge View display.
The wedge model can be zoomed in and out in the 2D Wedge View by rotating the mouse wheel.
To pan the wedge model in the 2D Wedge View left, right, up and down, press and hold the mouse wheel down while dragging.
Click on the 2D View icon to turn off the 2D Wedge View and restore the 3D Wedge View.
To restore the split-screen view in RocSlope2, double-click on anywhere off the model in the 3D Wedge View or click on All Analyses icon.
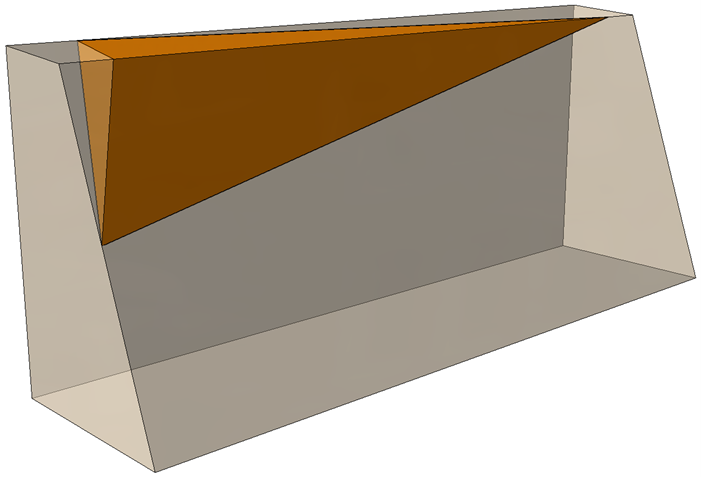
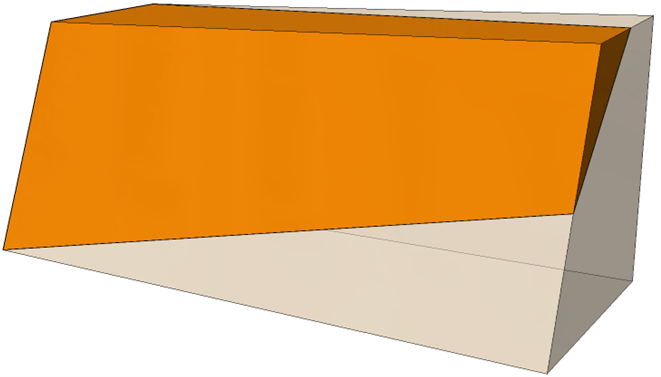
7.0 3D Planar View
The 3D Planar View is displayed when double-clicked on the Planar Analysis pane or clicked on the Planar Analysis  icon located on the toolbar.
While in the 3D Planar View, you can use the mouse buttons to interactively to manipulate the view as follows:
- Rotate for viewing at any angle with the left mouse button (or the mouse wheel).
- Move the wedge out of the slope with the left mouse button.
7.1 Rotating the Model
- Click on the Rotate View icon or press and hold the mouse wheel anywhere off the model in the 3D Planar View. The cursor changes to a circular arrow symbol to indicate that you can rotate the model.
- Keep the left mouse button (or the mouse wheel) pressed and move the cursor around. The model is rotated according to the direction of movement of the cursor.
- To exit the rotation mode, click on the Rotate View icon again or release the mouse wheel. The cursor reverts to the normal arrow.
- Repeat the above steps to rotate the model for viewing at any angle.
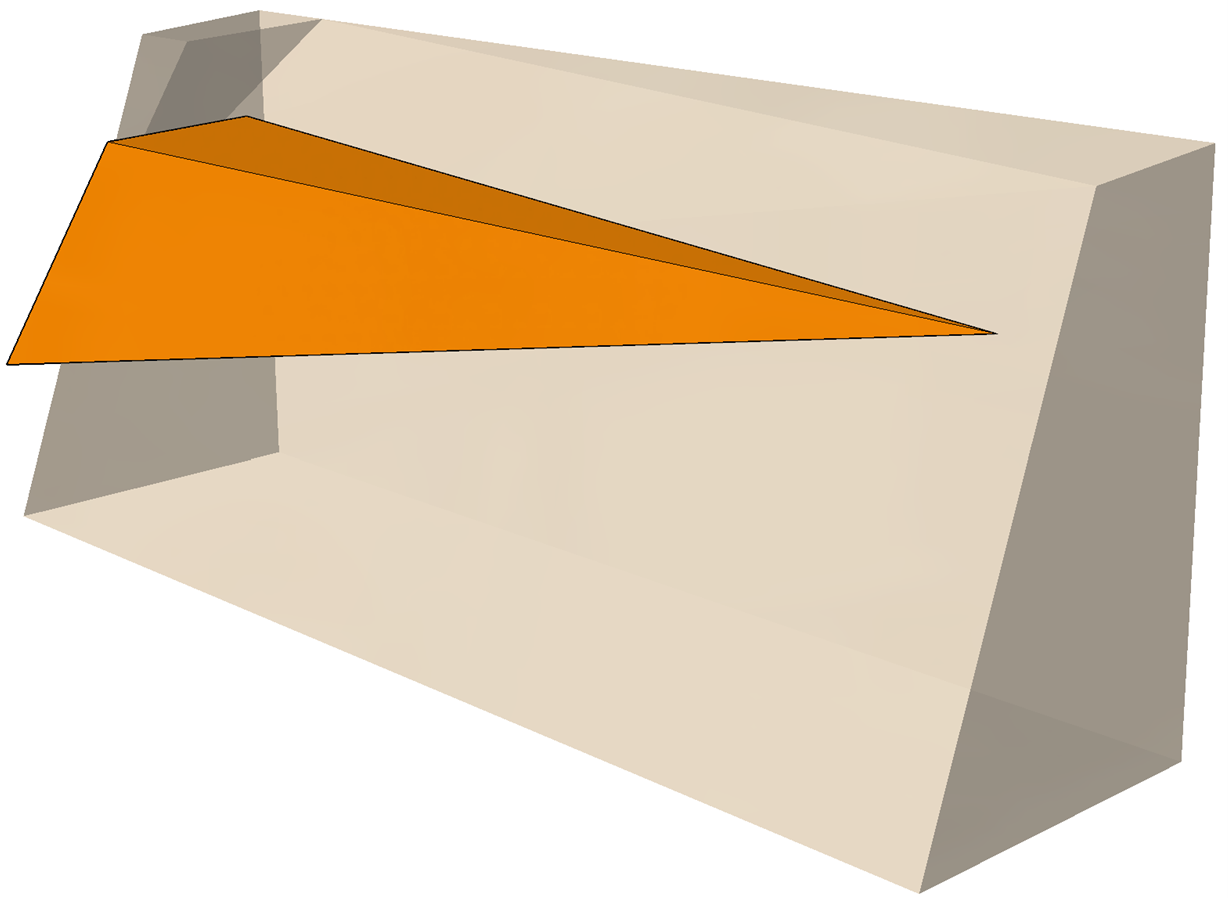
7.2 Moving the Planar Wedge
The planar wedge can be moved out of the slope by clicking and dragging with the left mouse button as described below.
To move the planar wedge with the left mouse button:
- Position the cursor over the planar wedge in the 3D Planar View. The cursor will change to a vertical, two-way arrow symbol.
- Click and hold the left mouse button and drag the mouse. As you move the cursor down, the planar wedge will slide out of the slope along the direction of sliding.
- If your model does NOT have a Tension Crack, the wedge slides along the Failure Plane.
- If your model has a Tension Crack, the wedge slides down along the Failure Plane, and up along the Tension Crack.
To reset the planar wedge to its default position within the slope:
- Right-click the mouse anywhere off the model in the 3D Planar View and select Reset Block Translation.
7.3 Zooming and Panning
The following zoom and pan options are available in the 3D Planar View:
- Zoom View
 - Zoom in and out within the view
 - Pan View - Translate the model left, right, up, or down within the view
- Rotate View - Rotate the model 360°
- Zoom Fit - Resize the model to fit the screen
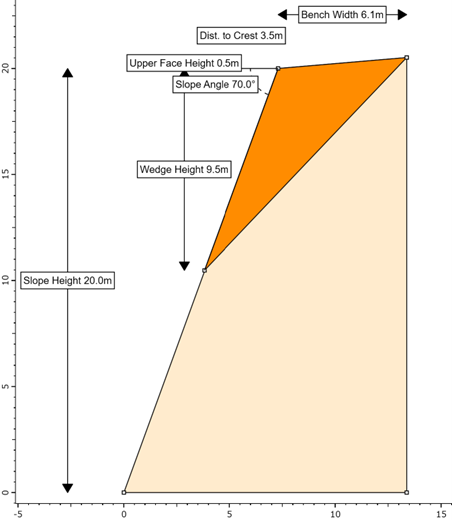
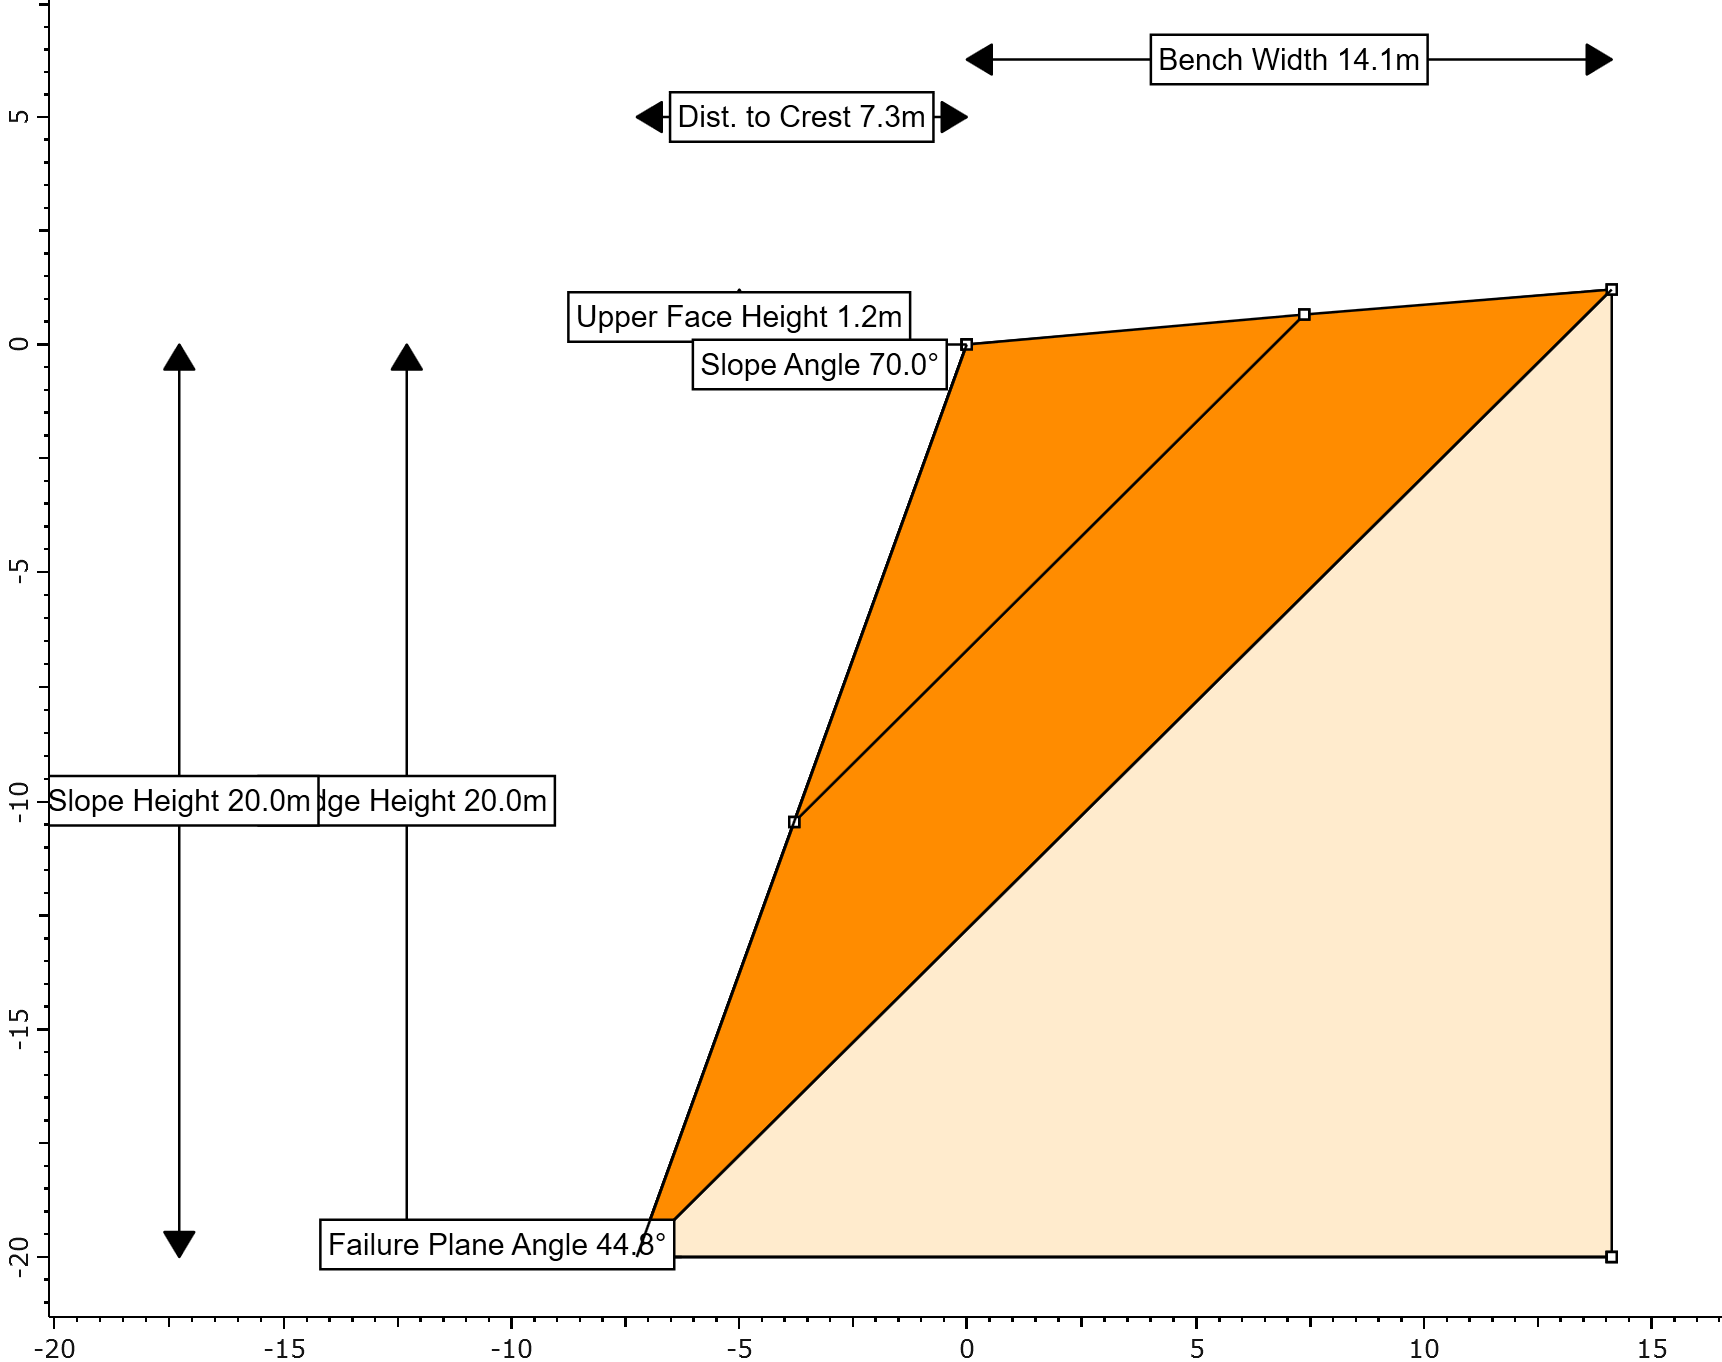
8.0 2D Planar View
The 2D Planar View in RocSlope2 allows you to display a two-dimensional view of your model. The view displays model lengths and angles as well as applied and resultant forces. To display the 2D Planar View:
- Select 2D View on the Views toolbar.
The planar wedge model can be zoomed in and out in the 2D Planar View by rotating the mouse wheel.
To pan the planar wedge model in the 2D Planar View left, right, up, and down, press and hold the mouse wheel down while dragging.
Click on the 2D View
icon to turn off the 2D Planar View and restore the 3D Planar View.
To restore the split-screen view in RocSlope2, double-click on anywhere off the model in the 3D Planar View or click on All Analyses icon.
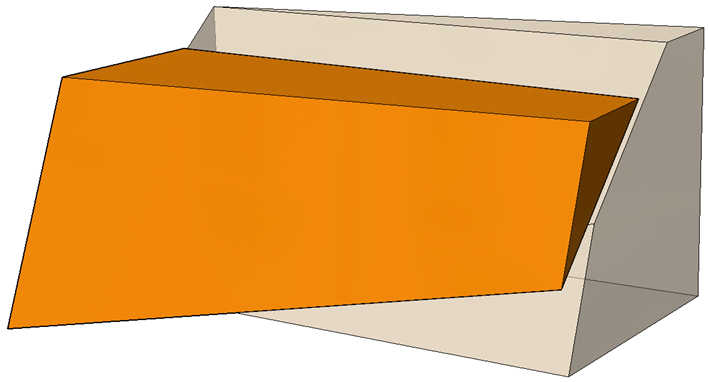
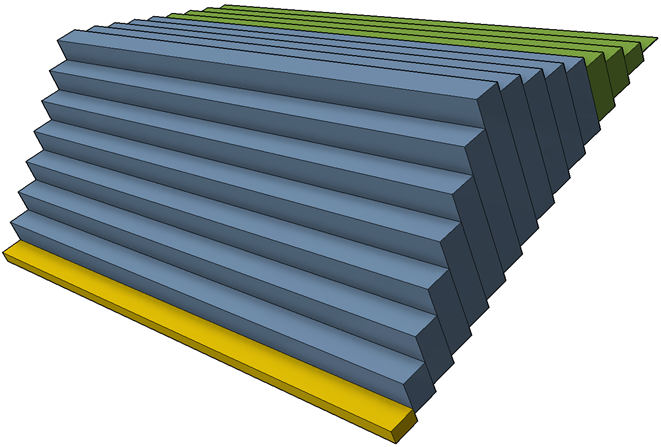
9.0 3D Toppling View
The 3D Toppling View is displayed when double clicked on the Toppling Analysis pane or clicked on the Toppling Analysis  icon located on the toolbar.
While in the 3D Toppling View, you can use the mouse buttons to interactively to manipulate the view as follows:
- Rotate for viewing at any angle with the left mouse button (or the mouse wheel).
- Move the sliding and toppling blocks out of the slope with the left mouse button.
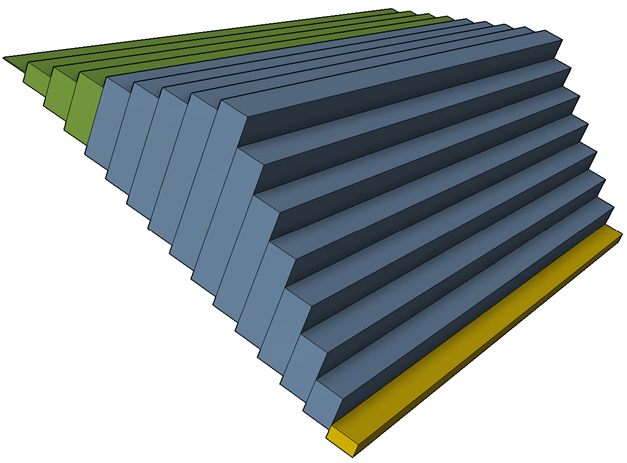
9.1 Rotating the Model
- Click on the Rotate View icon or press and hold the mouse wheel anywhere off the model in the 3D Toppling View. The cursor changes to a circular arrow symbol to indicate that you can rotate the model.
- Keep the left mouse button (or the mouse wheel) pressed and move the cursor around. The model is rotated according to the direction of movement of the cursor.
- To exit the rotation mode, click on the Rotate View icon again or release the mouse wheel. The cursor reverts to the normal arrow.
- Repeat the above steps to rotate the model for viewing at any angle.
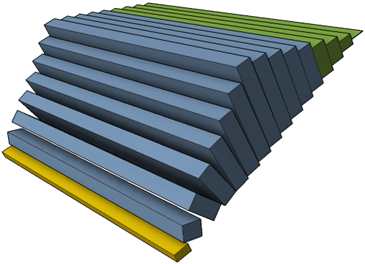
9.2 Moving the Blocks
The sliding and toppling blocks can be moved out of the slope by clicking and dragging with the left mouse button as described below.
To see how each block would fail and move the blocks with the left mouse button:
- Position the cursor over the slope in the 3D Toppling View. The cursor will change to a vertical, two-way arrow symbol.
- Click and hold the left mouse button and drag the mouse. As you move the cursor down, the blocks will move out of the slope along the direction of failure.
To reset the blocks to their default position within the slope:
- Right-click the mouse anywhere off the model in the 3D Toppling View and select Reset Block Translation
9.3 Zooming and Panning
The following zoom and pan options are available in the 3D Toppling View:
- Zoom View - Zoom in and out within the view
- Pan View - Translate the model left, right, up, or down within the view
- Rotate View - Rotate the model 360°
- Zoom Fit - Resize the model to fit the screen
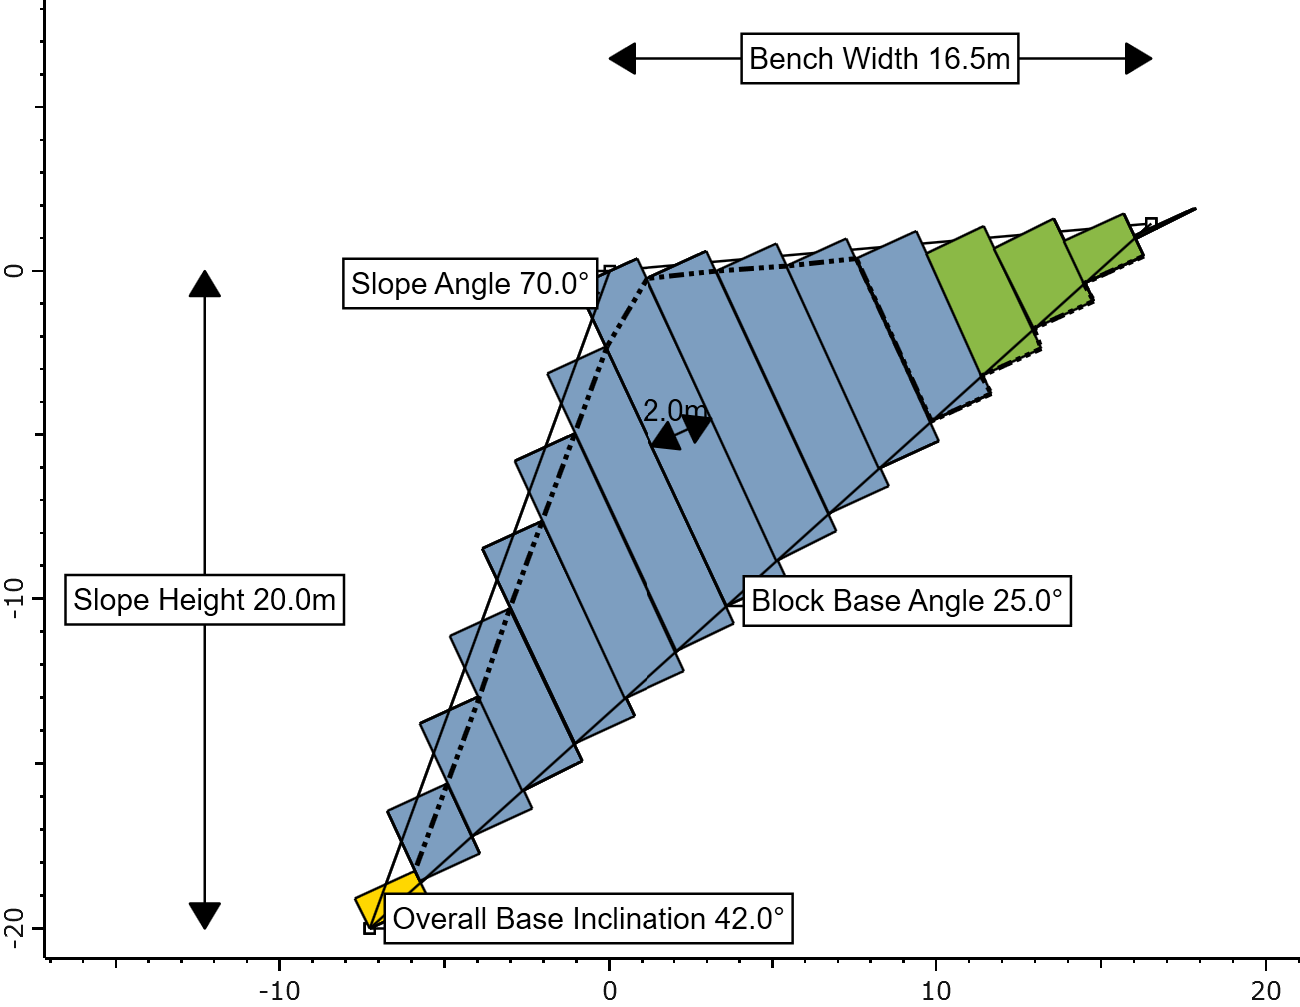
10.0 2D Toppling View
The 2D Toppling View in RocSlope2 allows you to display a two-dimensional view of your model. The view displays model lengths and angles as well as applied and resultant forces. To display the 2D Toppling View:
- Ensure Toppling Analysis is selected to activate the Views option.
- Select Views > 2D View in the toolbar.
The 2D Toppling View can be displayed individually by toggling the 3D View icon.
- The model can be zoomed in and out in the 2D Toppling View by rotating the mouse wheel.
- To pan the model in the 2D Toppling View left, right, up, and down, press and hold the mouse wheel down while dragging.
- Click on 2D View icon to turn off the 2D Toppling View and restore the 3D Toppling View.
- To restore the split-screen view in RocSlope2, double click on anywhere off the model in the 3D Toppling View or click on the All Analyses
 icon.
icon.
11.0 Display Options
You can change the appearance of 3D and 2D Views and set the number of decimals to be displayed for various values using the Display Options dialog. To open the dialog:
- Select Home > Display > Options

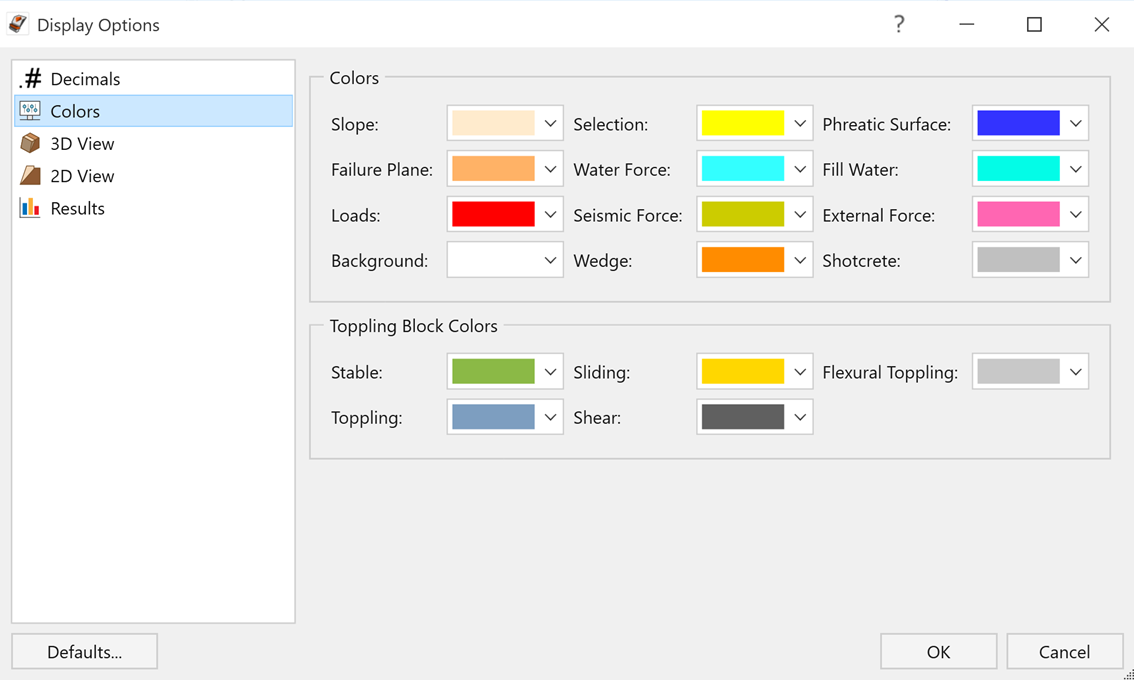
- Click OK to apply changes and close the dialog.
- Click Defaults to restore the original program settings.
- Click Cancel to close the dialog without applying any changes.
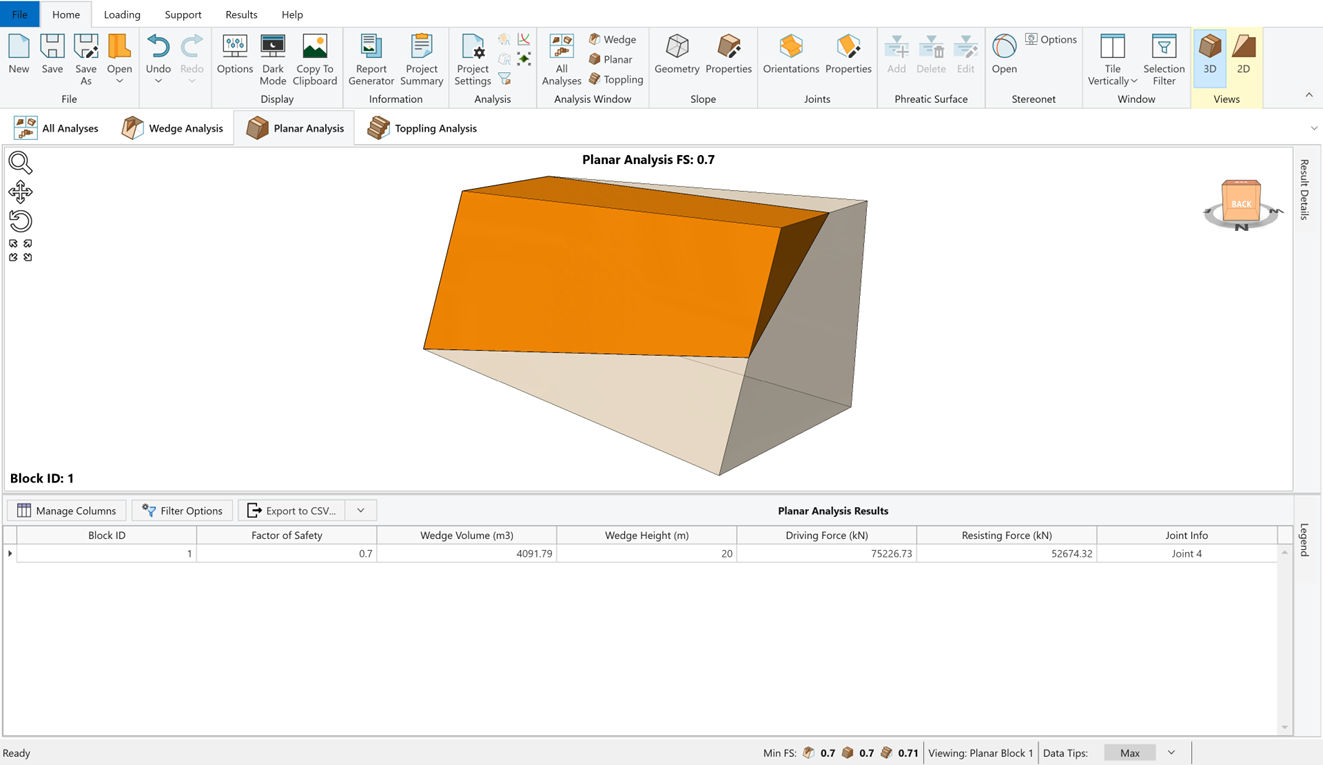
12.0 Analysis Results and Details
To ensure the latest analysis results are always displayed, RocSlope2 automatically computes an analysis whenever input data is entered or modified in a dialog and Apply or OK is clicked.
The primary result from a RocSlope2 Deterministic analysis is the Factor of Safety.
The lowest Factor of Safety and the corresponding Block ID and Geometry are displayed at each analysis pane for the corresponding analysis method, if a wedge/block is formed. The Factor of Safety also appears at the top of any 3D View when they are maximized.
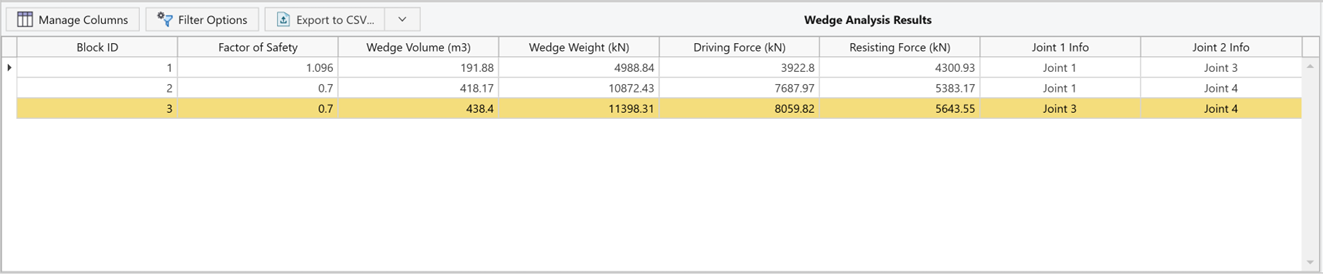
12.1 Results Grid
Notice that the Wedge Analysis pane is highlighted with a blue frame and the Wedge Analysis Results are displayed in the Results Grid at the bottom of the screen by default. The Results Grid displays the following data by default:
- Block ID
- Factor of Safety
- Wedge Information (Volume, Area, Weight, etc.)
- Driving and Resisting Forces
- Joint Information forming the block
- Double-click on any row in the Results Grid for the Wedge Analysis Results to see the formed wedge geometry and the corresponding Factor of Safety in the Wedge Analysis pane.
- Notice that the Block ID number at the bottom left corner of the Wedge Analysis pane is changed to the selected Block ID number instantly.
To see the analysis results details for other analysis methods:
- Click anywhere in the Planar Analysis or Toppling Analysis pane with the left mouse button to select and display the analysis results in the Results Grid for the corresponding analysis method.
- Notice that the selected analysis pane is now highlighted, and the Results Grid displays the corresponding analysis results and details.
Notice that the Toppling Analysis Legend is displayed next to the Results Grid by default. The Toppling Analysis Legend is minimized or maximized by clicking on the Legend button.
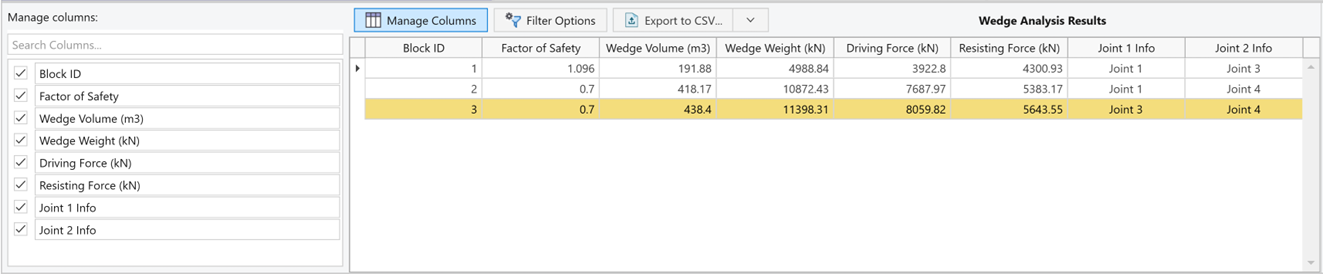
12.2 Editing Results Grid
The columns displaying the data in the Results Grid can be edited and managed by:
- Clicking the Manage Columns button on the Results Grid.
- Checking/Unchecking an option under Manage Columns to Enable/Disable the data to be displayed.
- Rearranging the order of displayed data by left clicking and dragging the data box to the desired order.
To filter the displayed data results:
- Click the Filter Options button on the Results Grid.
- Click on Edit Filters to maximize the drop down menu.
- Select the Filters to be applied.
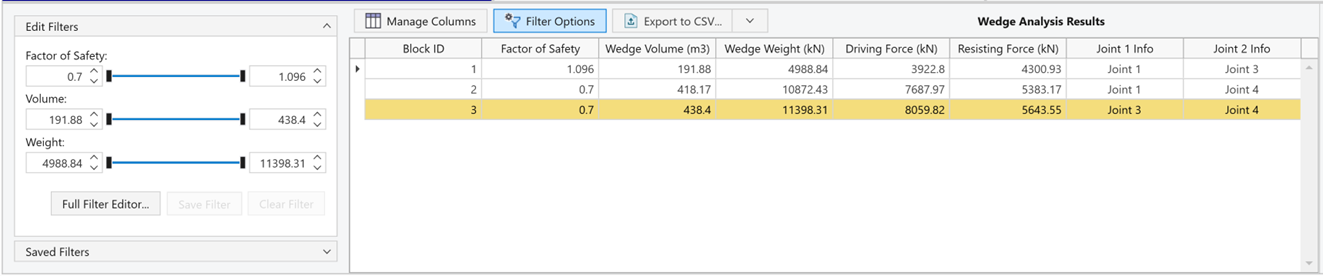
TIP: Applied filters can be saved for future use.
12.3 Result Details
A more detailed summary of wedge and planar analysis results is displayed in the Result Details sidebar. To open the Result Details sidebar:
- Double-click on the Wedge Analysis pane to switch to 3D Wedge View.
- Click the Result Details button on the right side of the pane to maximize the sidebar.
- Notice that a more detailed results summary for the selected block is displayed in the Result Details sidebar.
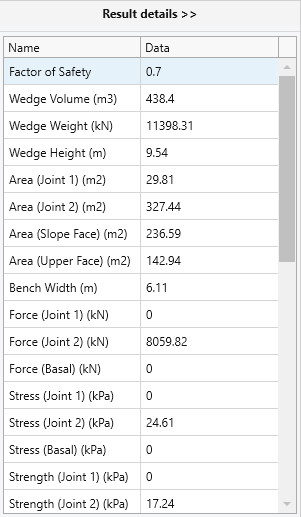
- Double-click on any row in the Results Grid to see the detailed results summary for the selected block.
TIP: To apply a filter to the displayed data in the Result Details sidebar, left click on the Name or Data cell and set the Filter Rules or Filter Values.
13.0 Export Results
RocSlope2 has the following options in the Results Grid for exporting results:
- Export current results to CSV
- Export current results to Excel
- Export all results to CSV
- Export all results to Excel
To export the currently viewed slope and result block geometry as an .obj file select File > Export 3D Geometry.
14.0 Additional Exercise
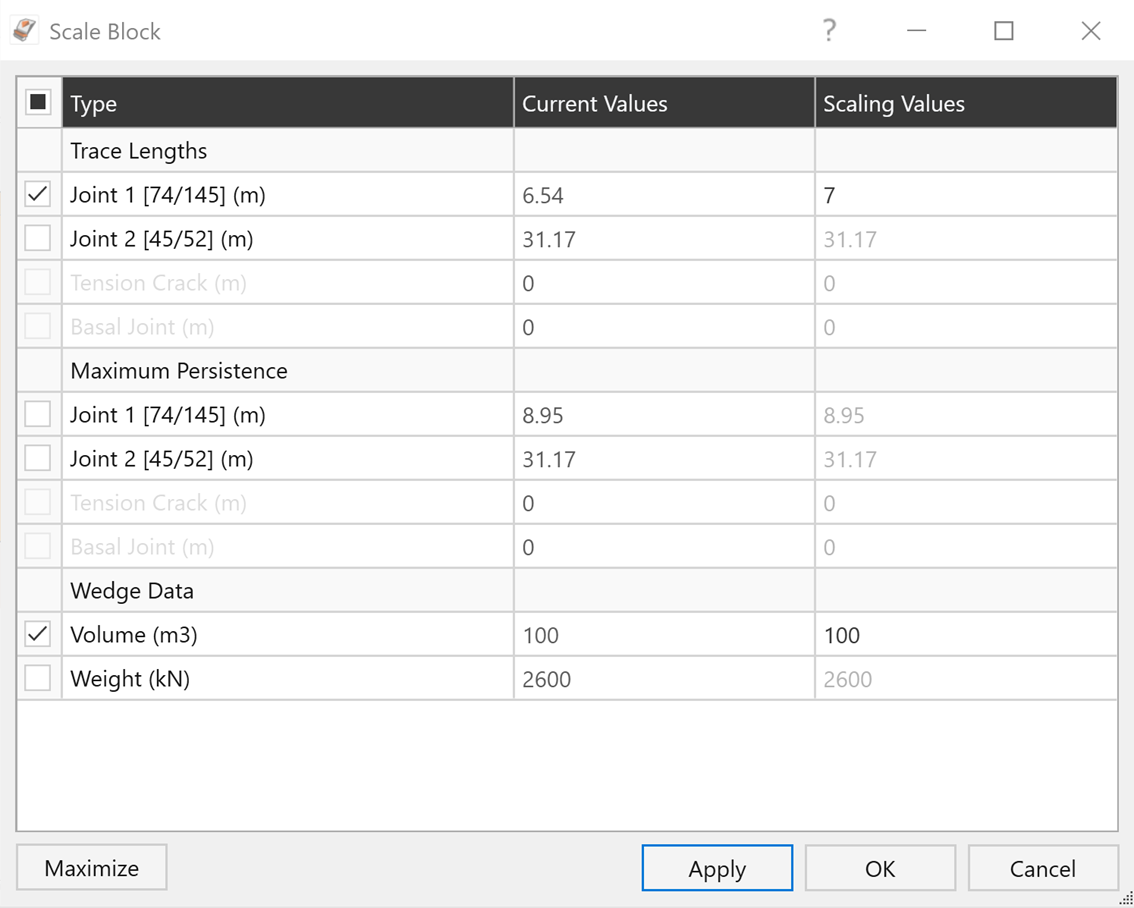
14.1 Scale Block
The Scale Block option allows you to limit or scale the size of blocks in the Wedge or Planar analysis models according to Joint Trace Lengths and/or Maximum Persistence (Wedge analysis), Failure Plane (Planar analysis), Wedge Volume or Weight (both).
Let's start by scaling Block ID=3 wedge by Trace Length.
- First select Block ID=3 by double clicking it in the Results Grid.
- Then to open the Scale Block dialog, select Home > Analysis > Scale Block

- Under Trace Lengths, select the Joint 1 check box and enter Scaling Values = 7 in the corresponding box.
Note that the current value of the parameter is listed under Current Values. - Click Apply.

Because we entered a Trace Length of 7 m for Joint 1, which is smaller than the Current Value of 10.47 meters, the wedge size has been reduced accordingly. Note that the Trace Length may occur on EITHER the Slope Face or the Upper Face. The larger value is always used.
Note the following:
- The wedge Volume has been reduced to 122.64 m3.
- The wedge Weight has been reduced to 3188.69 kN.
- The wedge Factor of Safety is 0.7.
Double click on any block in the Results Grid while the Scale Block dialog is open to select the block and examine its scaled values. Notice that the scaling value we entered is applied all the blocks listed in Results Grid for Wedge Analysis.
Now, let's scale Block ID = 3 wedge by Volume.
- Select Home > Analysis > Scale Block to re-open the Scale Block dialog.
- Under Wedge Data, select the Volume check box and enter Scaling Values =100 in the corresponding box.
Note that the current value of the parameter is listed under Current Values. - Click Apply.
The wedge size is again reduced.
Note the following:
- The wedge Volume has been reduced to 100 m3.
- The wedge Weight has been reduced to 2600 kN.
- The wedge Factor of Safety is 0.7.
Double click on any block in the Results Grid while Scale Block dialog is open to select the block and examine its newly scaled values.
The general rule here is: "When multiple scaling parameters are defined, the parameter that results in the smallest wedge controls the wedge size."
For a Probabilistic Analysis, multiple scaling parameters can be useful if the wedge plane orientations are random variables, because different scaling parameters may be applied to different wedges. However, for any individual wedge generated by a Probabilistic, only the scaling parameter which gives the smallest wedge will be applied.
To conclude:
- Select Home > Analysis > Scale Block one more time to re-open the Scale Block dialog.
- Click on Maximize to reset wedge scaling.
- Click OK.
Repeat the scaling exercise for Planar Analysis.
This concludes the tutorial. You are now ready to proceed to the next tutorial, Tutorial 2 – Importing a Dips File.