2 - Importing a DIPS File
1.0 Introduction
Kinematic analysis is a preliminary check for various rock slope stability failure modes on a stereonet plot by simply inputting the slope orientation, friction angle and lateral limits. The usual design procedure is to use kinematic analysis to identify potentially unstable blocks, followed by a detailed limit equilibrium-based stability analysis of these blocks. Therefore, kinematic analysis is a precursor to a detailed limit equilibrium to indicate tendency of failure by the various modes.
DIPS is Rocscience’s stereographic projection analysis program designed for interactive analysis of orientation based geological data and visualization of orientation vectors. In DIPS, you can perform kinematic analysis of joints, and then smoothly extend your kinematic analysis to a full equilibrium analysis in RocSlope2 thanks to the seamless integration between RocSlope2 and DIPS.
This tutorial will demonstrate the ability of RocSlope2 to import a list of joints from a DIPS file into a single joint set in the Joint Orientations dialog. This method proves advantageous when analyzing large number of unclustered joint orientation data.
Topics Covered in this Tutorial:
- Importing Unclustered Joint Orientations from a DIPS File
- Stereonet View
- Wedge, Planar and Toppling Results
Finished Product:
The finished product of this tutorial can be found in the Tutorial 2 Importing a DIPS File.rocslope2 file, located in the Examples > Tutorials folder in your RocSlope2 installation folder.
2.0 DIPS File
A DIPS file has been provided for importing into RocSlope2 during the tutorial (Tutorial 2.dipsresults).
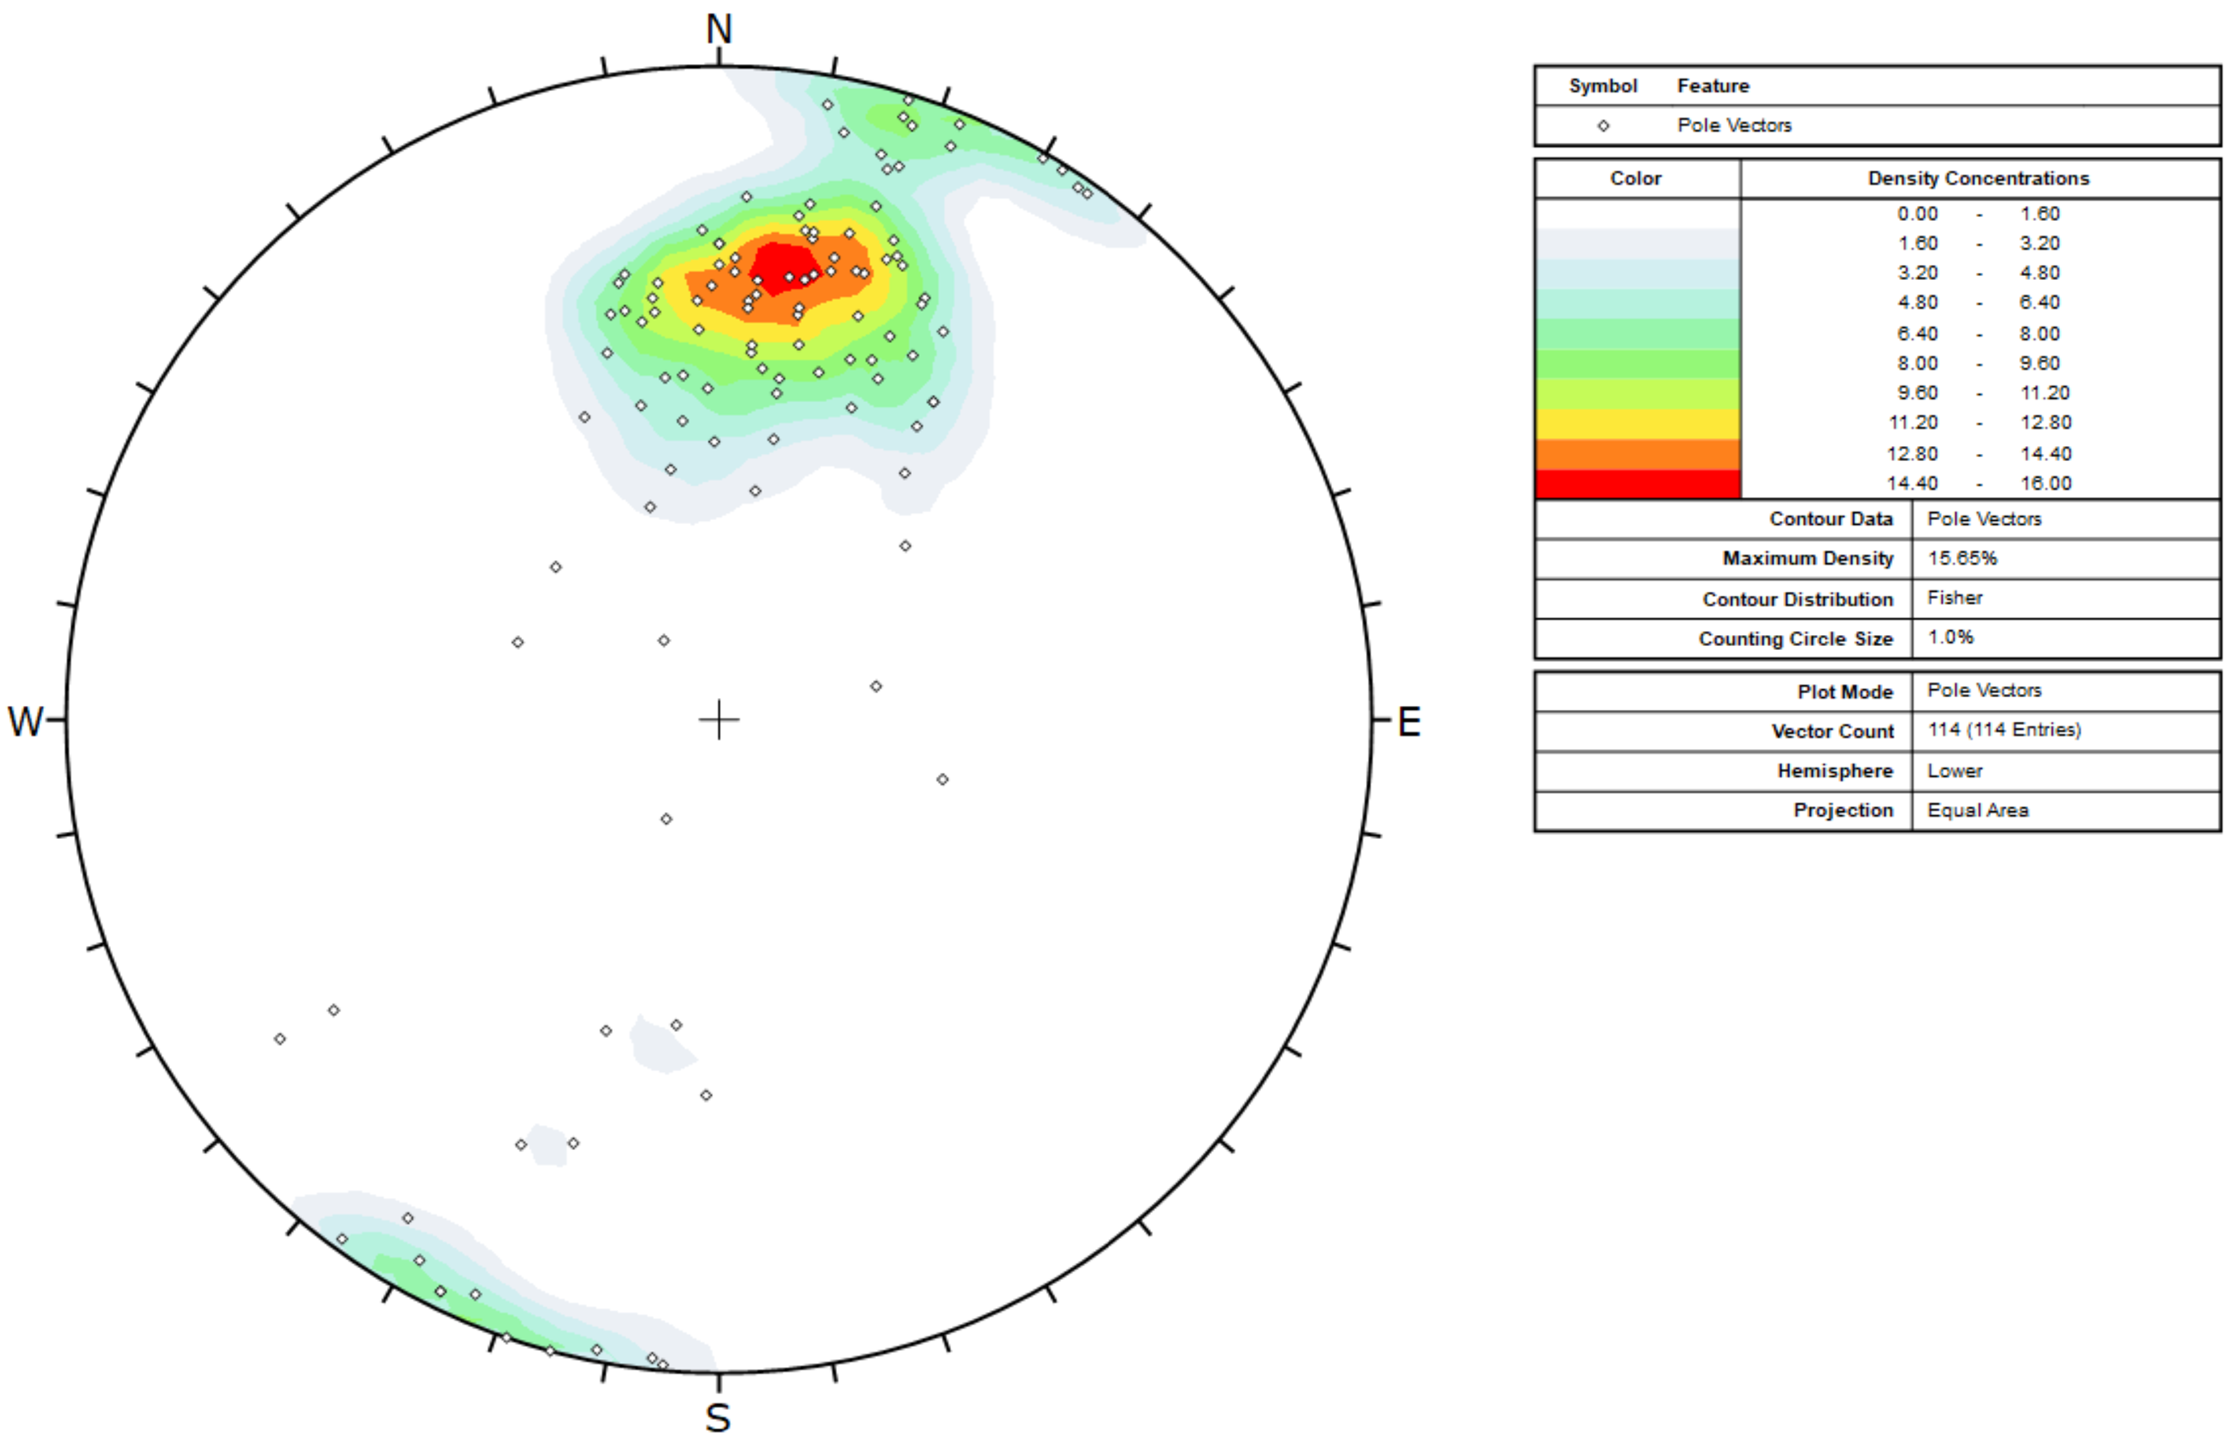
The DIPS file we are using in this tutorial has 114 poles (joint orientation measurements). The Stereonet View of the plotted data in DIPS looks as follows:
2.1 Wedge Sliding Kinematic Analysis
The Wedge Sliding kinematic analysis failure mode is a test for sliding of wedges formed by the intersection of two planes.
The results of a wedge sliding kinematic analysis performed in DIPS, using the same slope orientation which we will use in RocSlope2, are shown below:
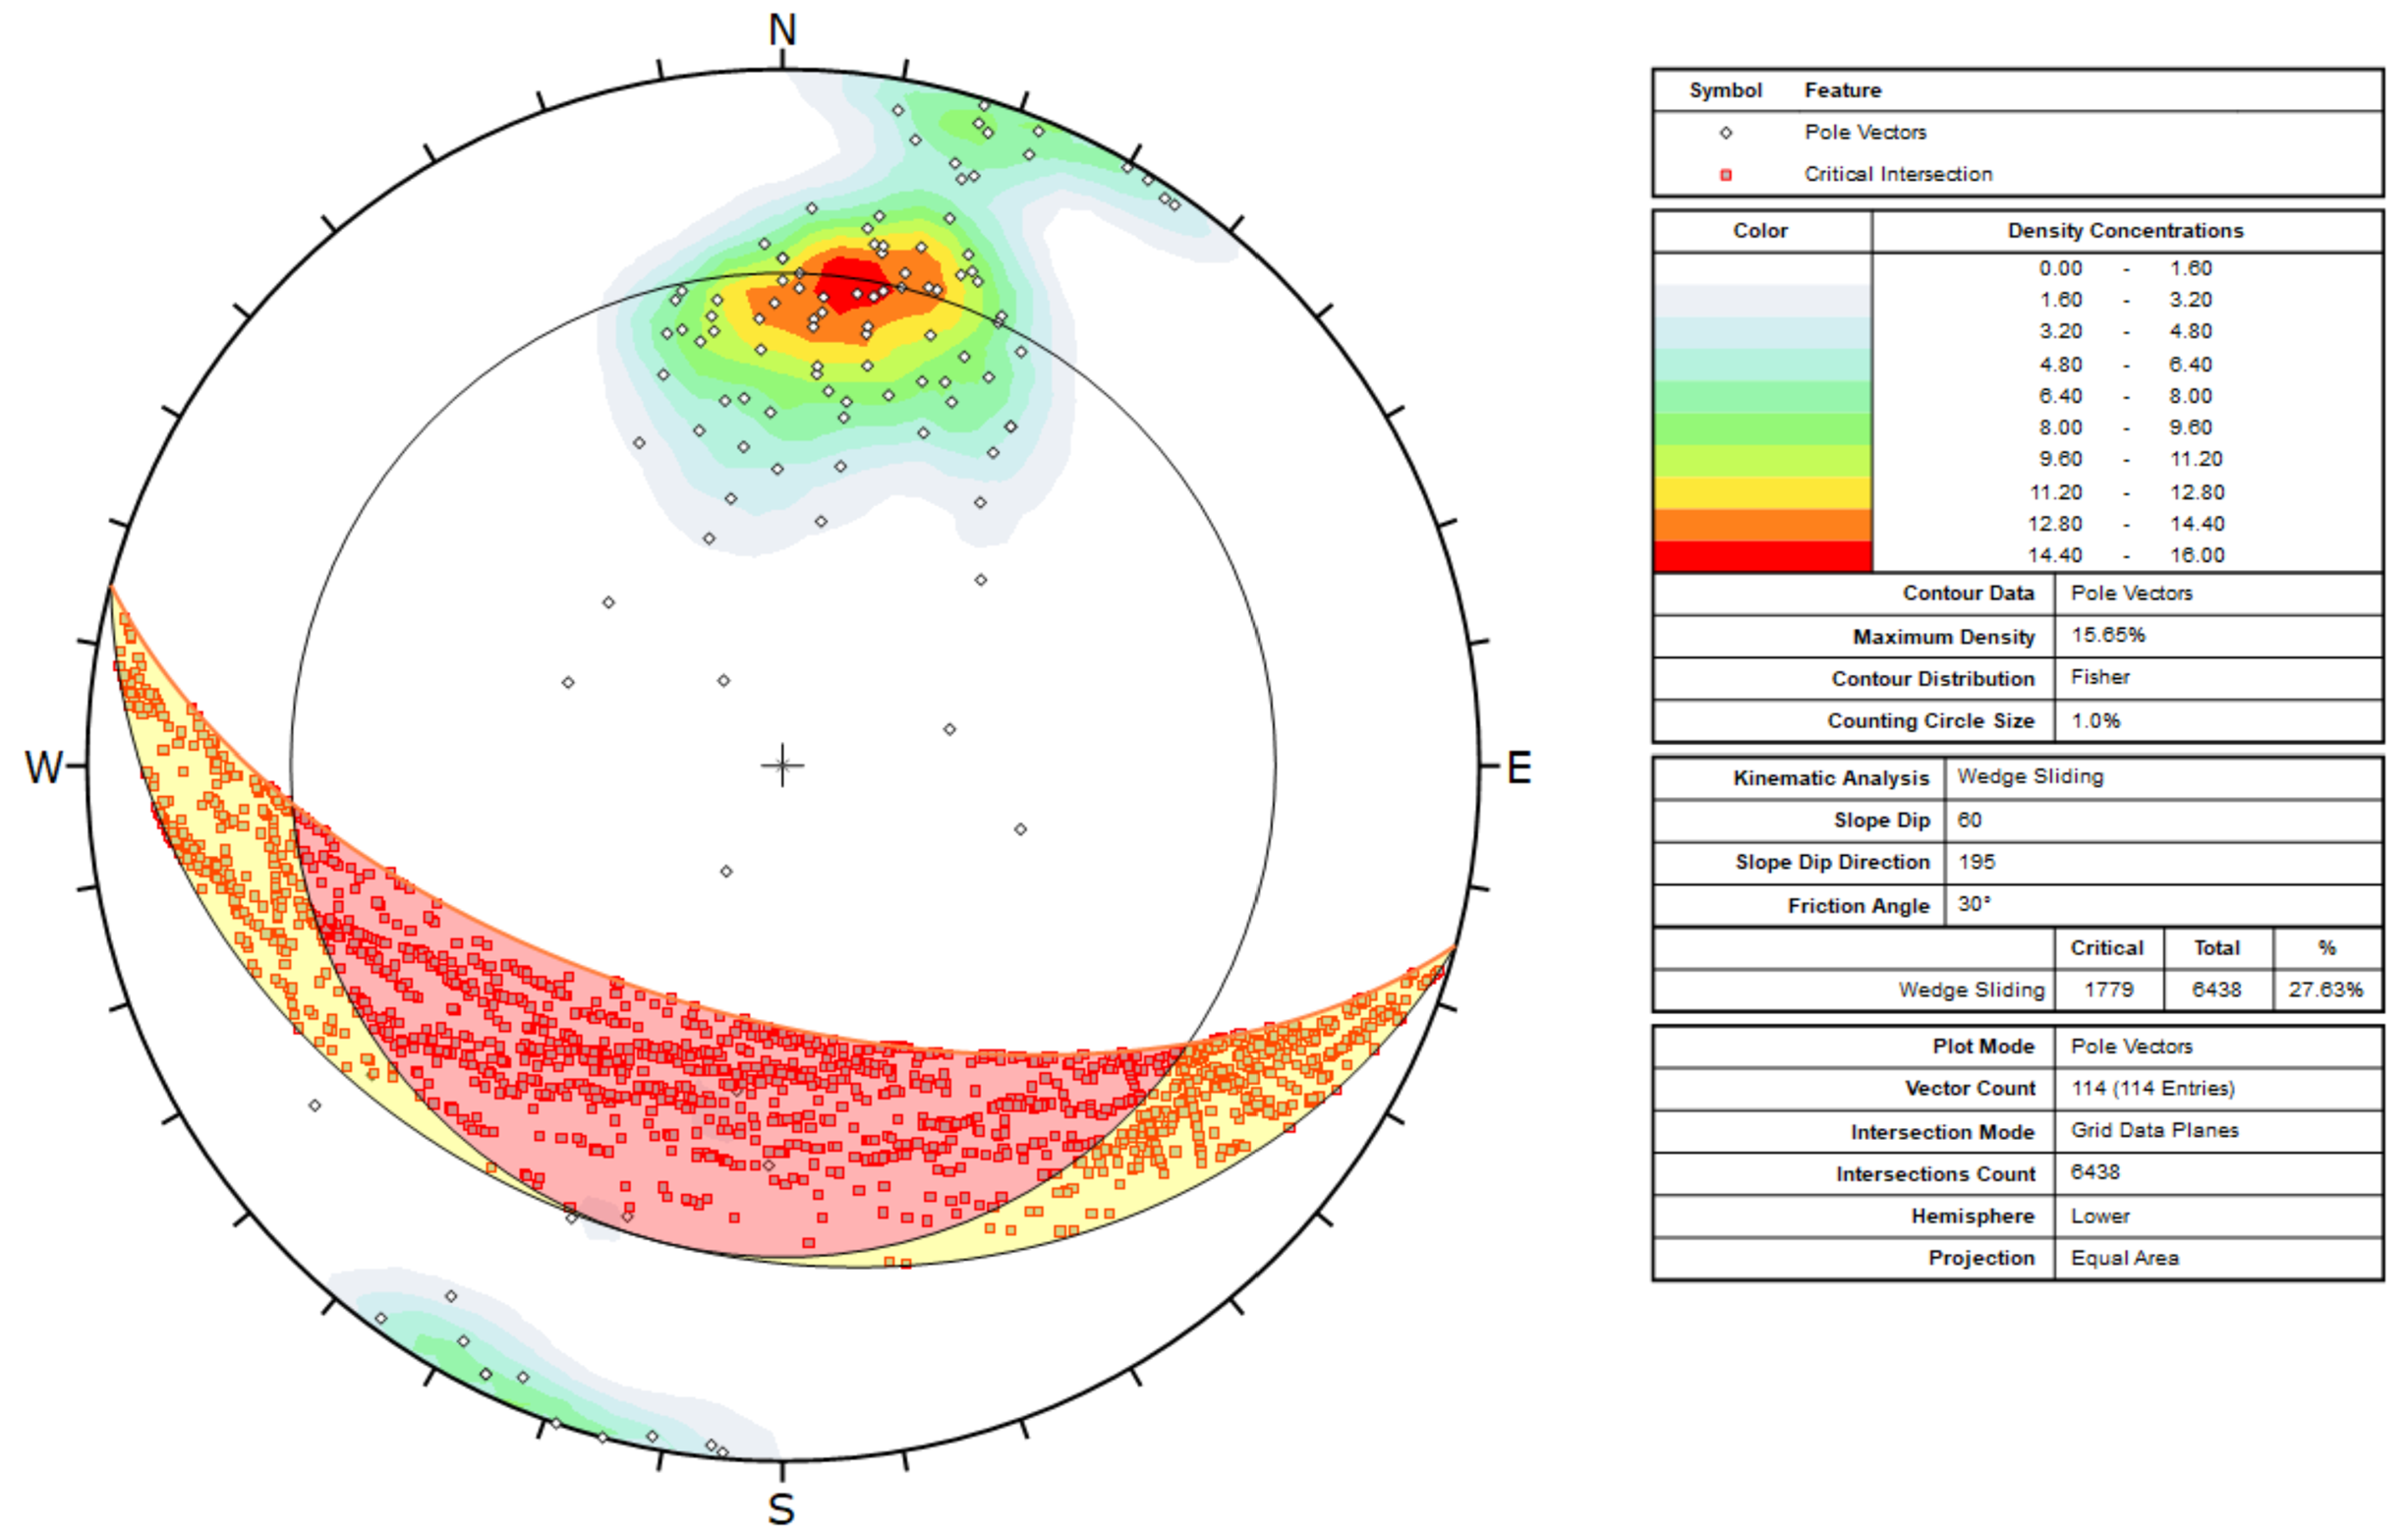
Notice the number of critical intersections within the critical zone is 1784 and the critical percentage of the number of intersections within the critical zone with respect to the total number of intersections (6438) is 27.71%.
2.2 Planar Sliding Kinematic Analysis
The Planar Sliding kinematic analysis failure mode is a test for sliding on a single plane.
DIPS Planar Sliding kinematic analysis results performed by using the same slope orientation we will use in the RocSlope2 model are displayed as follows:
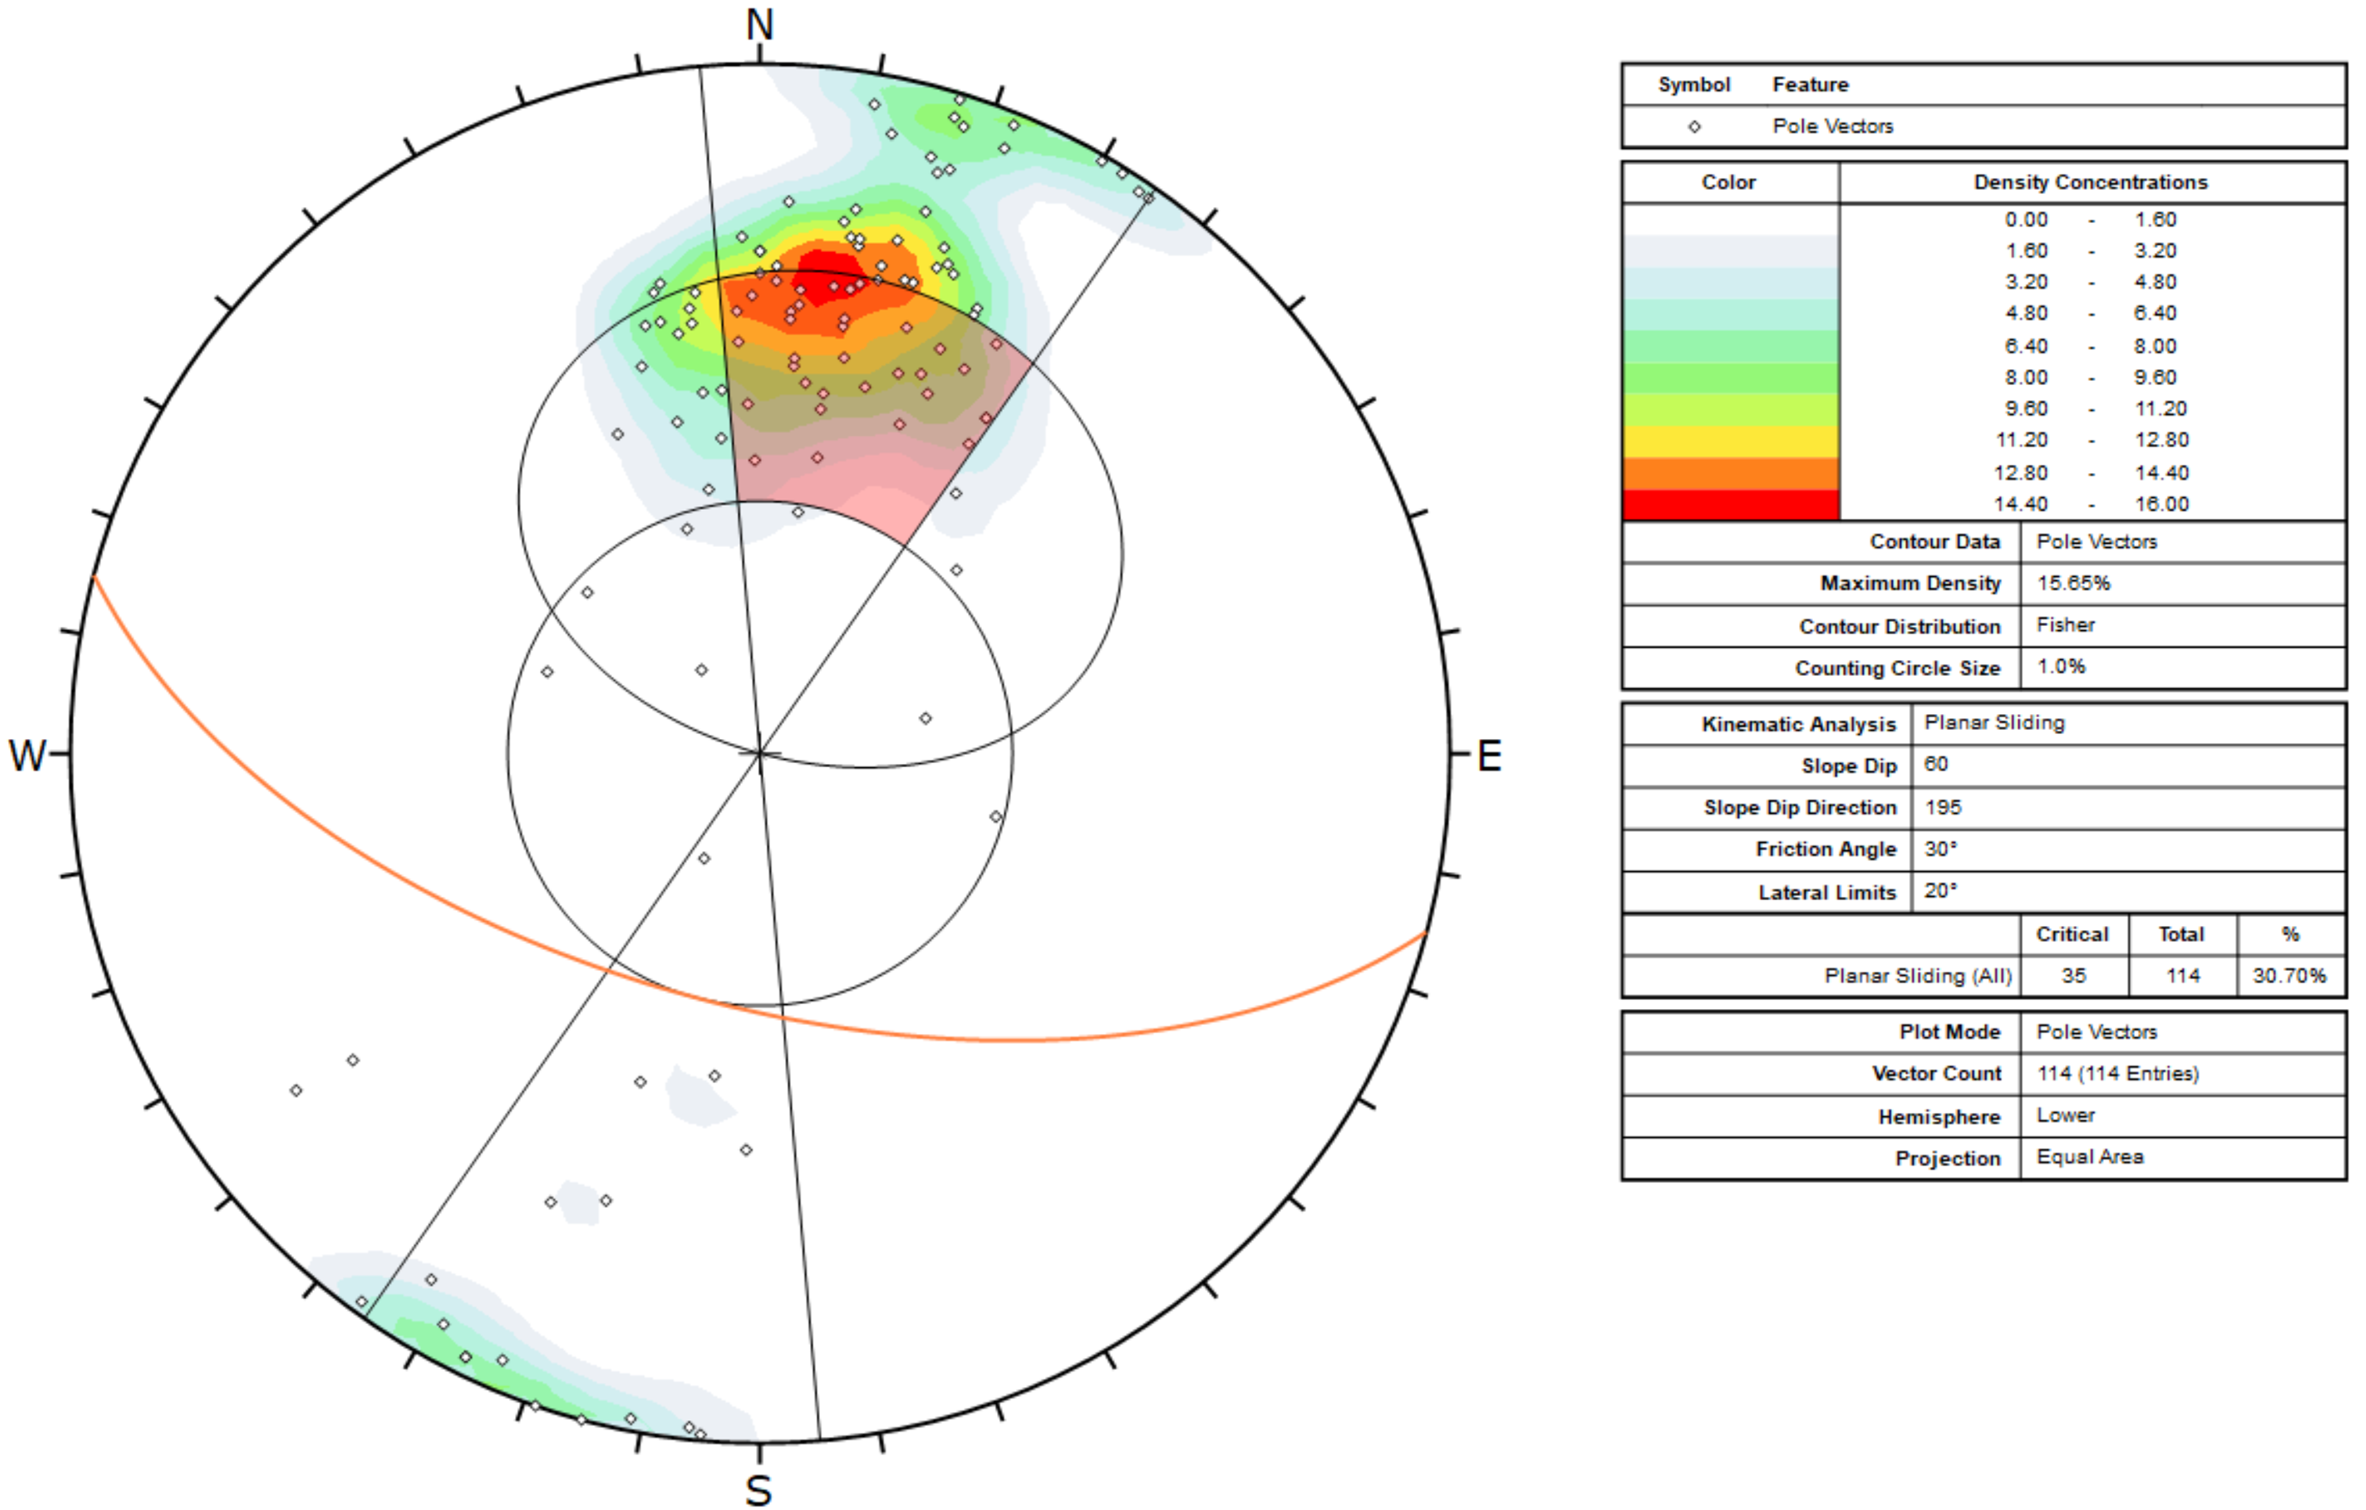
Notice the number of critical poles within the critical zone is 35 and the critical percentage of the poles within the critical zone with respect to the total number of poles is 30.70%.
2.3 Flexural Toppling Kinematic Analysis
The Flexural Toppling kinematic analysis failure mode is a test for Flexural Toppling as defined in Goodman (1980).
DIPS Flexural Toppling kinematic analysis results performed by using the same slope orientation we will use in the RocSlope2 model are displayed as follows:
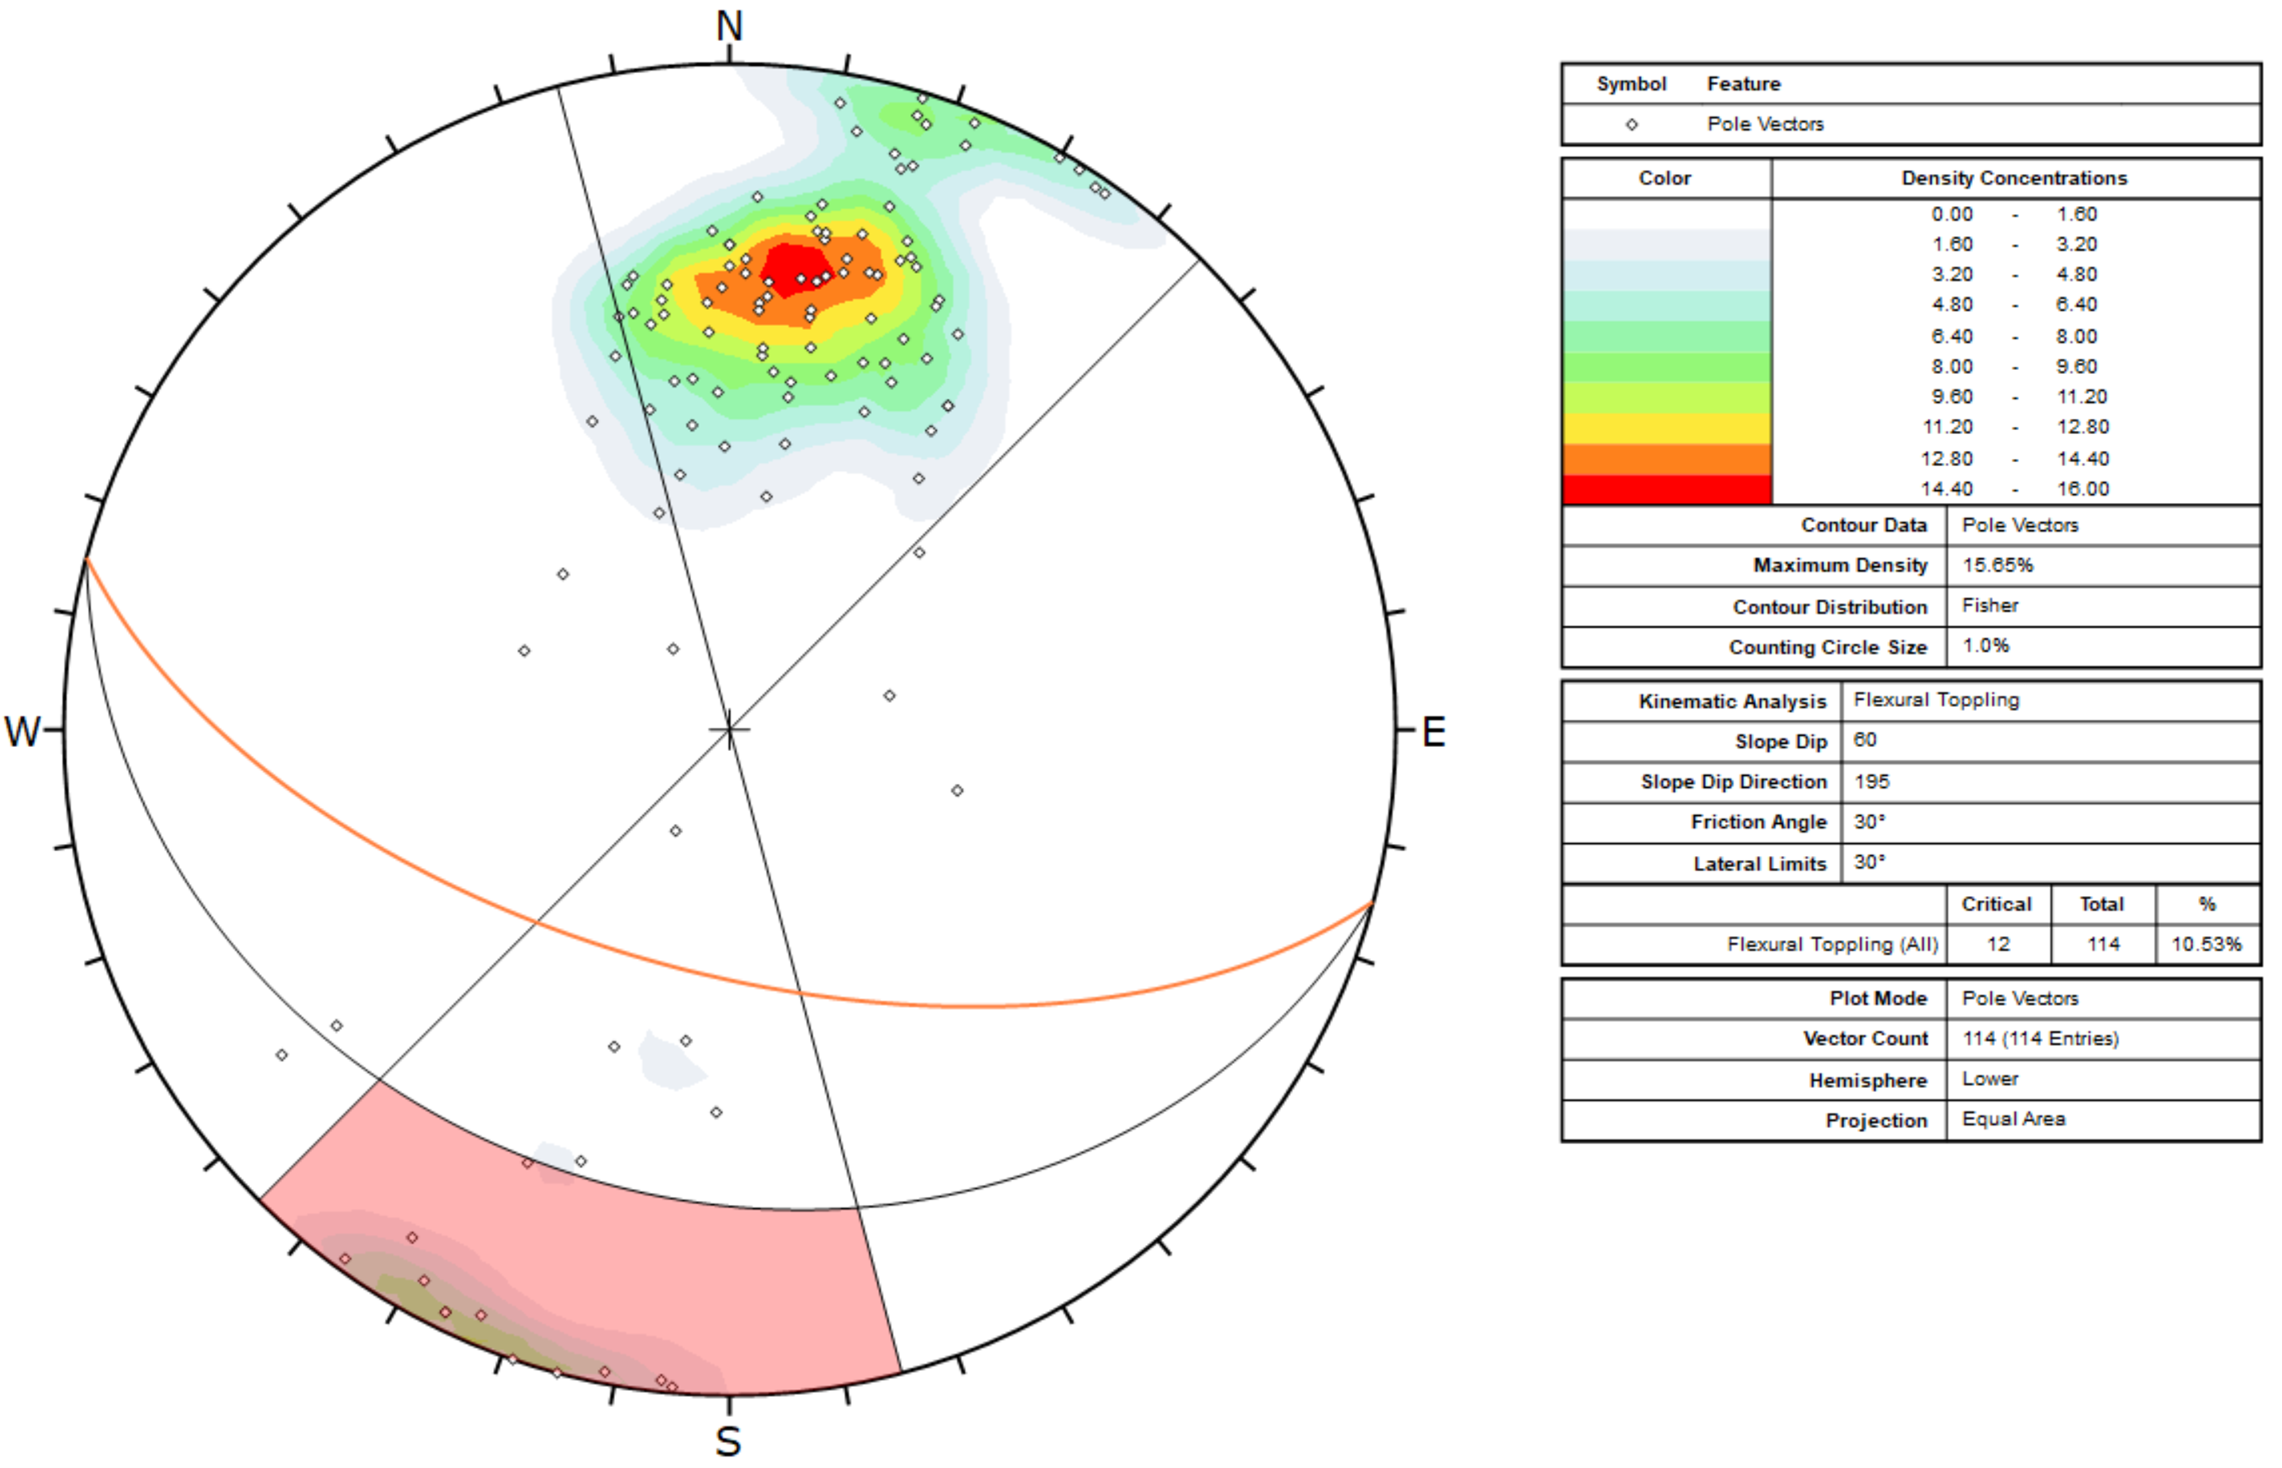
Notice the number of critical poles within the critical zone is 12 and the critical percentage of the poles within the critical zone with respect to the total number of poles is 10.53%.
2.4 Kinematic Analysis vs. Limit Equilibrium Analysis
As mentioned above, kinematic analysis is a preliminary analysis to determine the influence of the joints on stability by studying only the relationship between the orientation of the joint and the slope. In kinematic analysis, it is assumed that planes/vectors have an infinite length/persistence. Kinematic analysis only considers joint orientation, slope orientation, joint friction angle and lateral limits (if applicable). Hence, it does not provide information on block factor of safety.
Kinematic analysis should be followed by a detailed limit equilibrium based stability analysis where block dimensions, slope geometry, shear strengths along joint(s), groundwater effects, joint persistence, external forces, etc. are comprehensively accounted for.
2.5 Exporting DIPS Results
Results from DIPS Version 9.001 and newer must be exported to a .dipsresults file before they can be imported into RocSlope2. This functionality is covered in DIPS - Export Results. Versions of DIPS prior to Version 9.001 do not support exporting .dipsresults files. Instead, the original DIPS file (e.g. .dips8) is imported into RocSlope2 directly.
3.0 RocSlope2 Model
- If you have not already done so, run the RocSlope2 program by double-clicking the RocSlope2 icon in your installation folder or by selecting Programs > Rocscience > RocSlope2 in the Windows Start menu.
- Select File > New Project

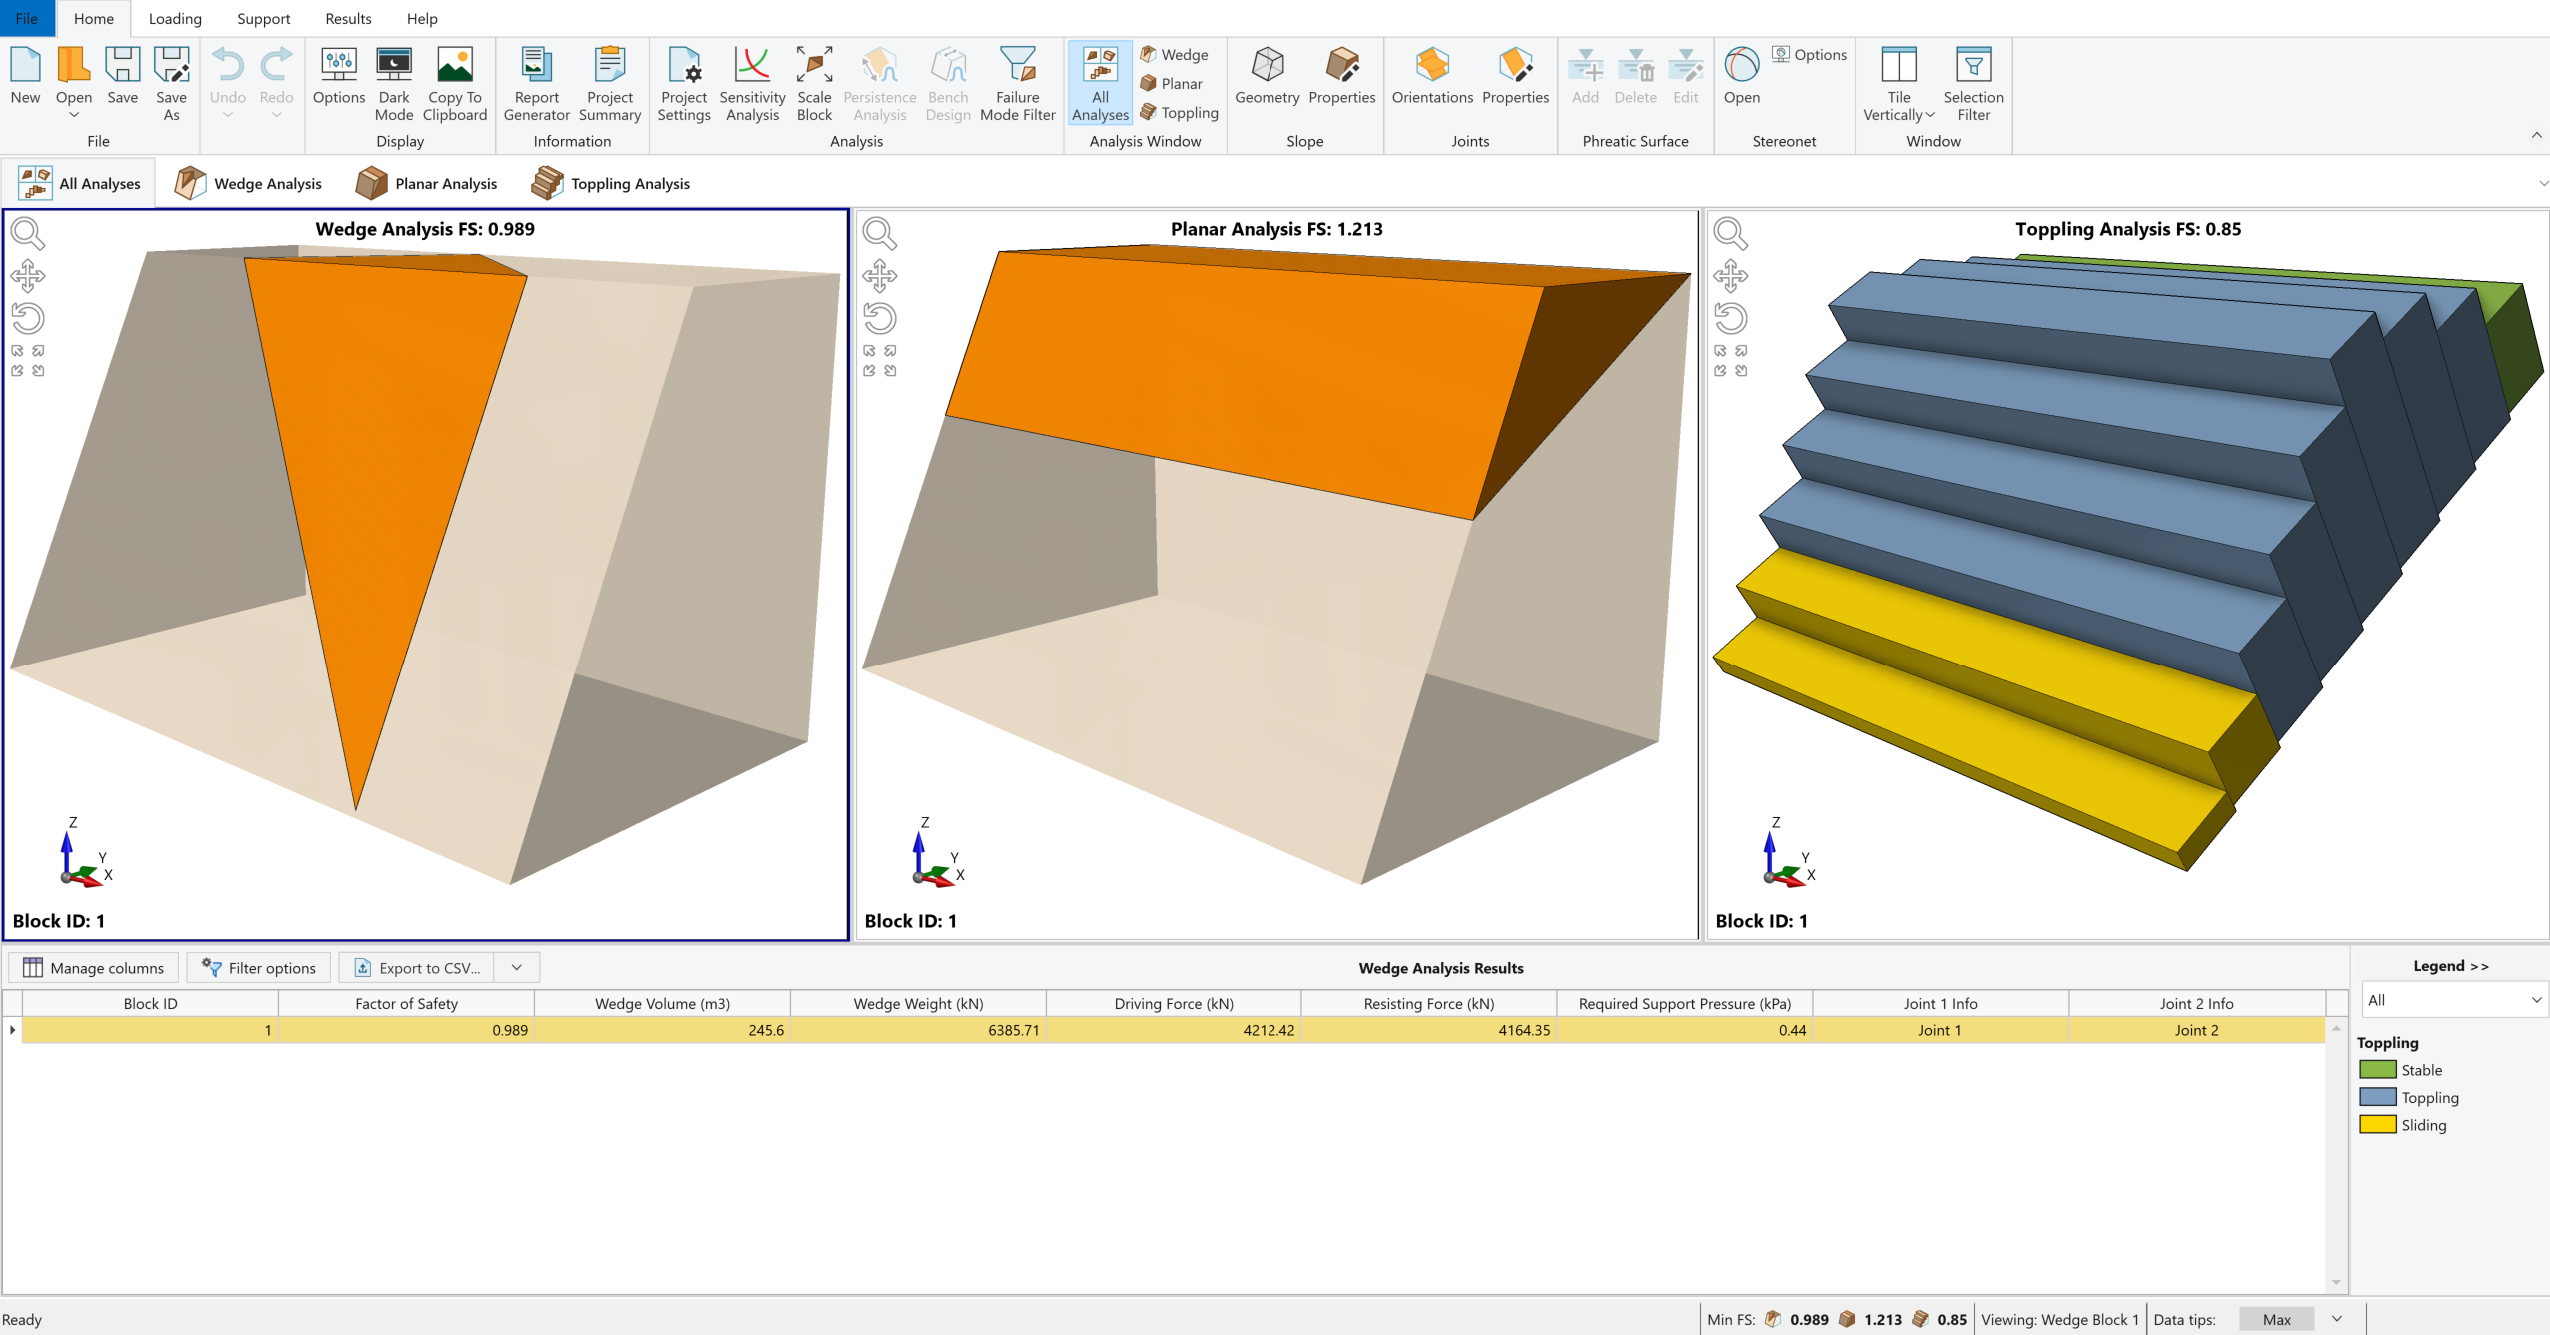
Whenever a new file is created, the default input data forms valid slope geometries for wedge, planar and toppling analysis, as shown in the image below.
If the RocSlope2 application window is not already maximized, maximize it now so that the full screen is available for viewing the model.
Notice the four-pane, split-screen format of the display, which shows Wedge, Planar and Toppling analysis as well as the results grid pane.
3.1 Project Settings
Before we start, we'll make sure Project Settings are the way we want them.
- Select Home > Project Settings
 on the toolbar.
 - In the Units tab, ensure Units = Metric, stress as kPa.
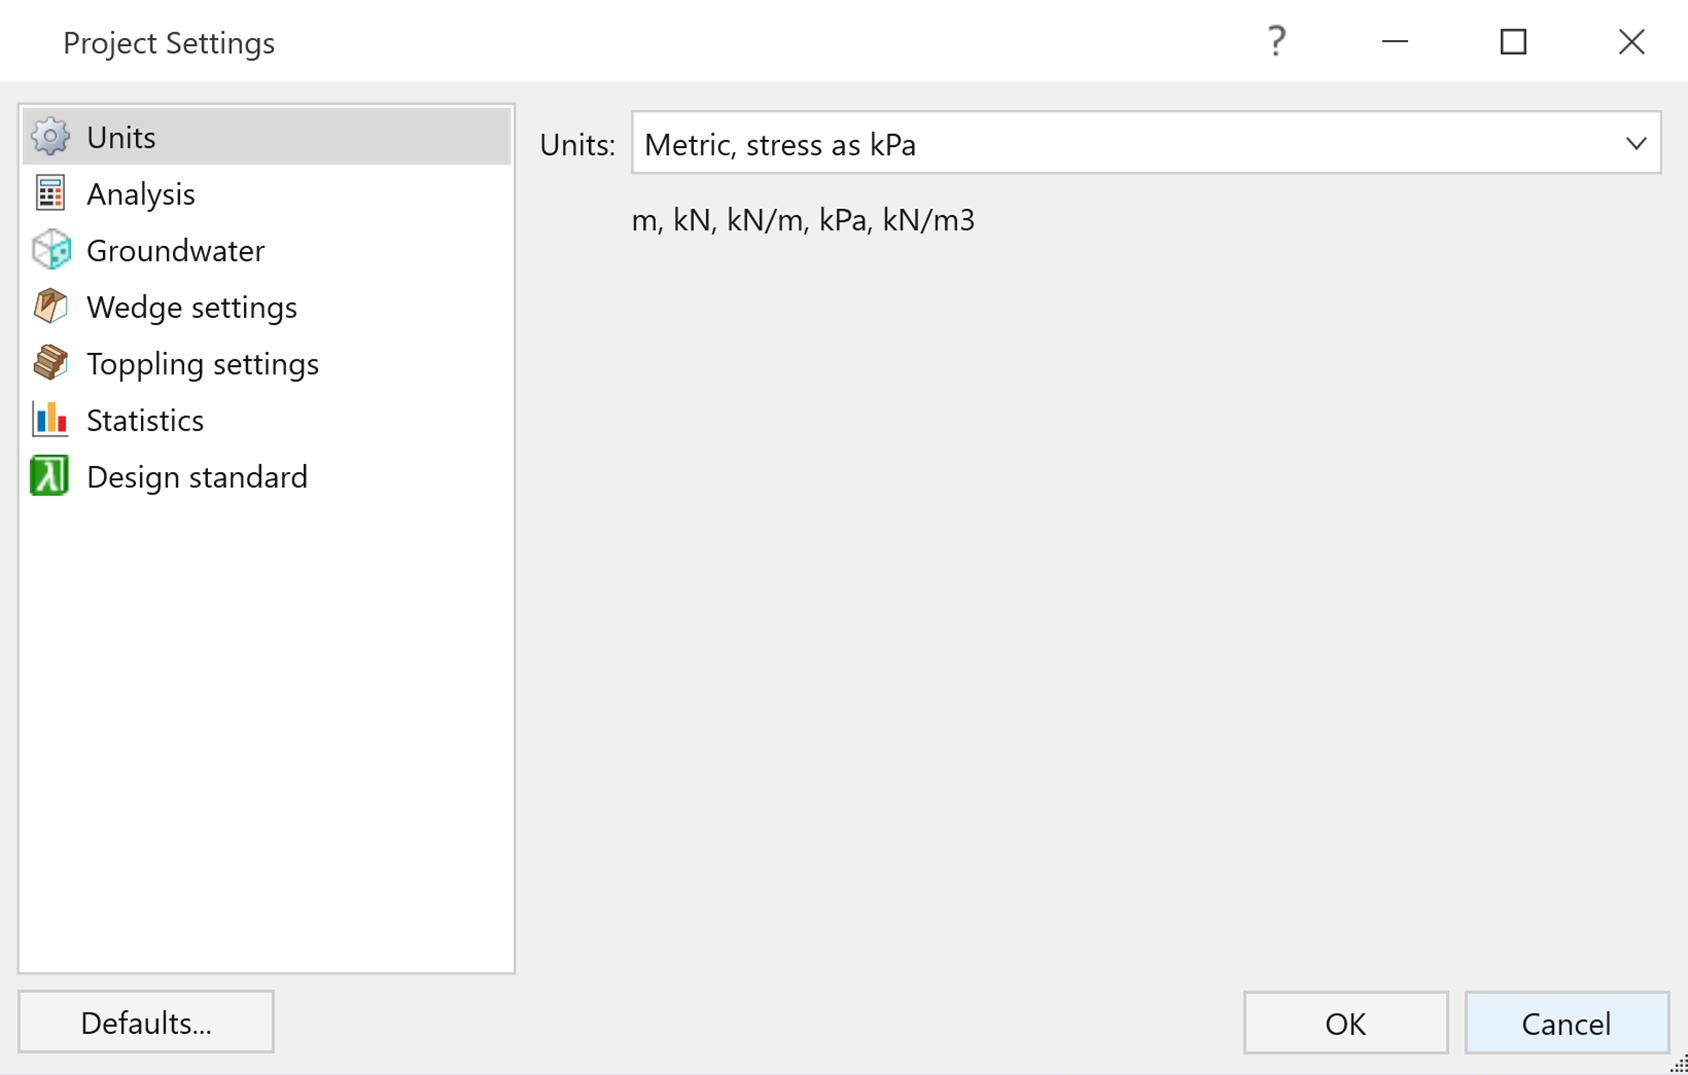
RocSlope2 Project Settings dialog – Units tab - In the Statistics tab, ensure that the analysis type is Deterministic.
- Click OK to close the dialog.
3.2 Slope Geometry
- Select Home > Slope > Geometry

- Change the Slope Geometry input data to the following:
- Enable Use Default Bench Width by clicking on the checkbox next to it.
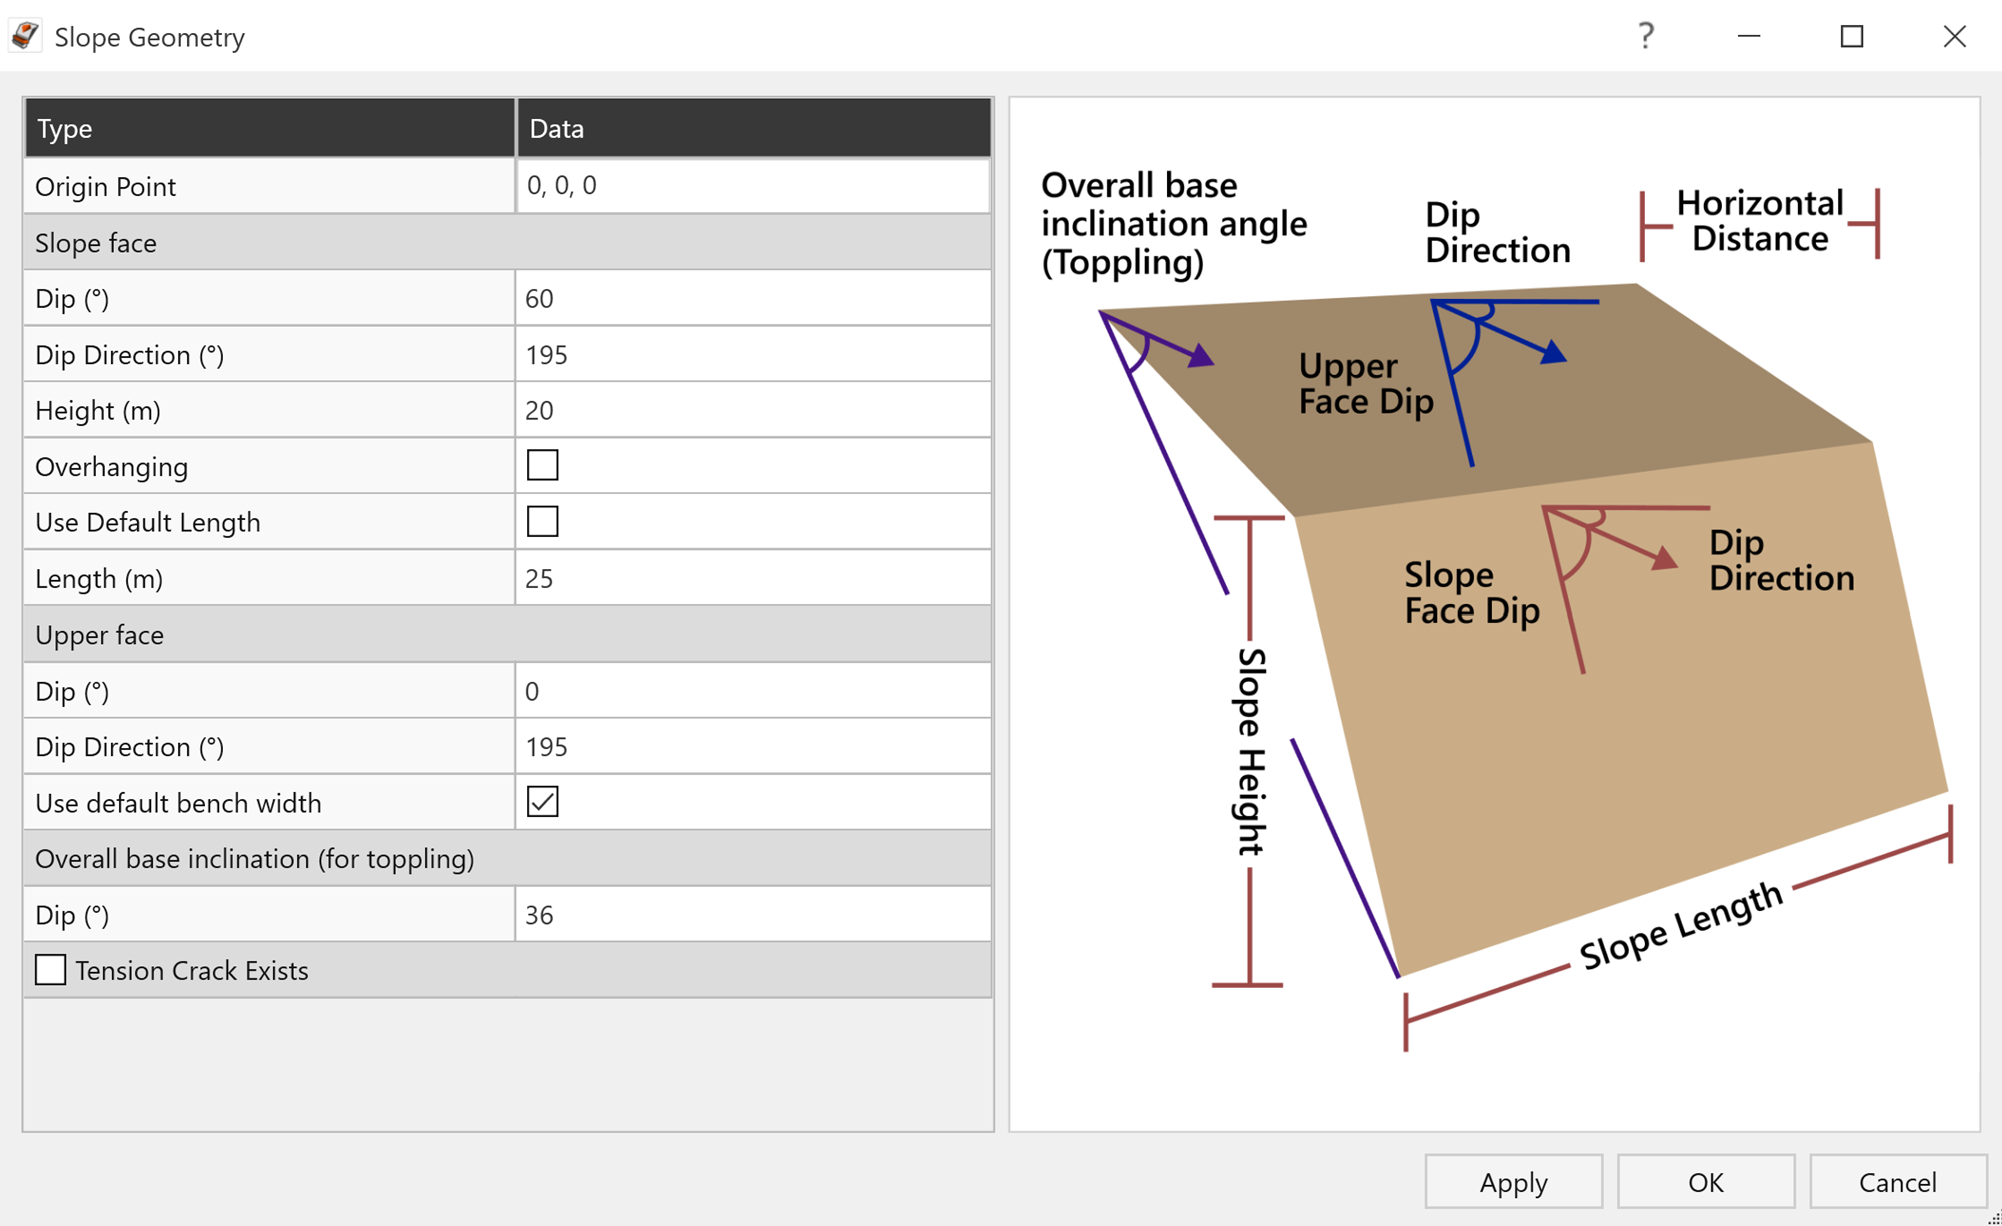
RocSlope2 Slope Geometry dialog - Click Apply.
- Click OK to accept the Slope Geometry input data and close the dialogue.
Slope Face Dip (°) |
60 |
Slope Face Dip Direction (°) |
195 |
Height (m) |
20 |
Slope Face Length (m) |
25 |
Upper Face Dip (°) |
0 |
Upper Face Dip Direction (°) |
195 |
Overall Base Inclination / Dip (°) |
36 |
3.3 Slope Properties
- Select Home > Slope > Properties

- Under the Material Strength tab, set Unit Weight to 25 kN/m3
- Click Apply.
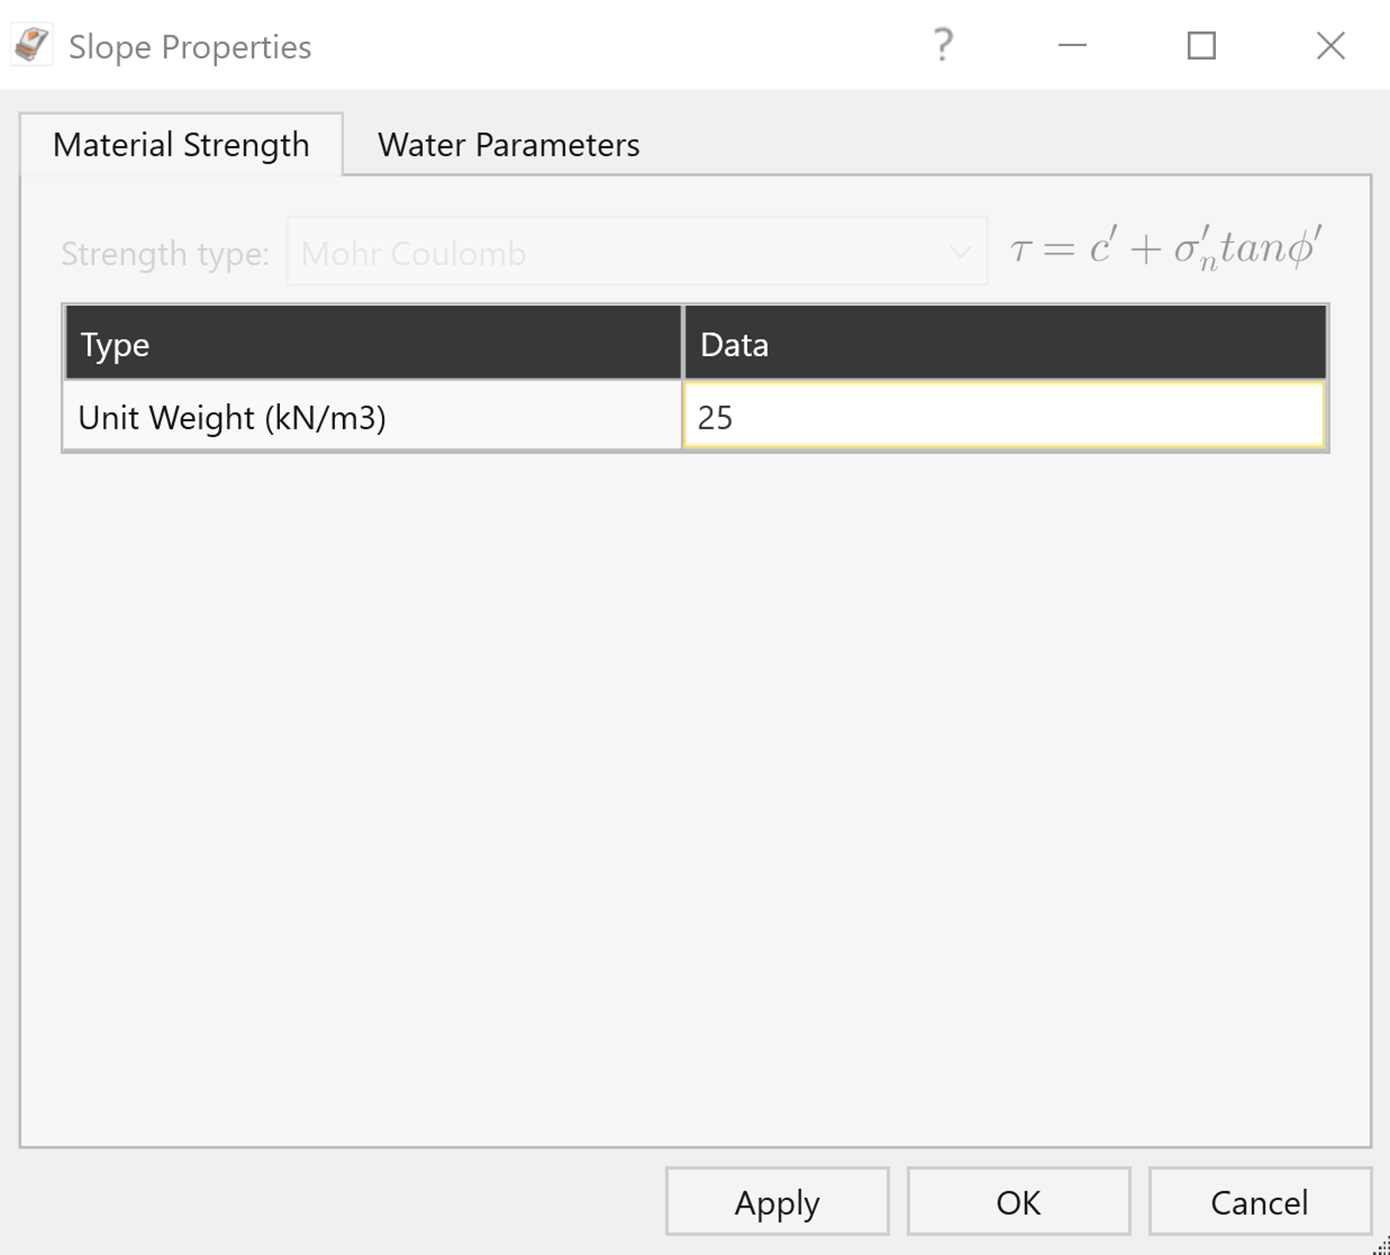
RocSlope2 Slope Properties dialog - Material Strength tab - Click OK to accept the Slope Properties input data and close the dialogue.
3.4 Joint Properties
- Select Home > Joints > Properties

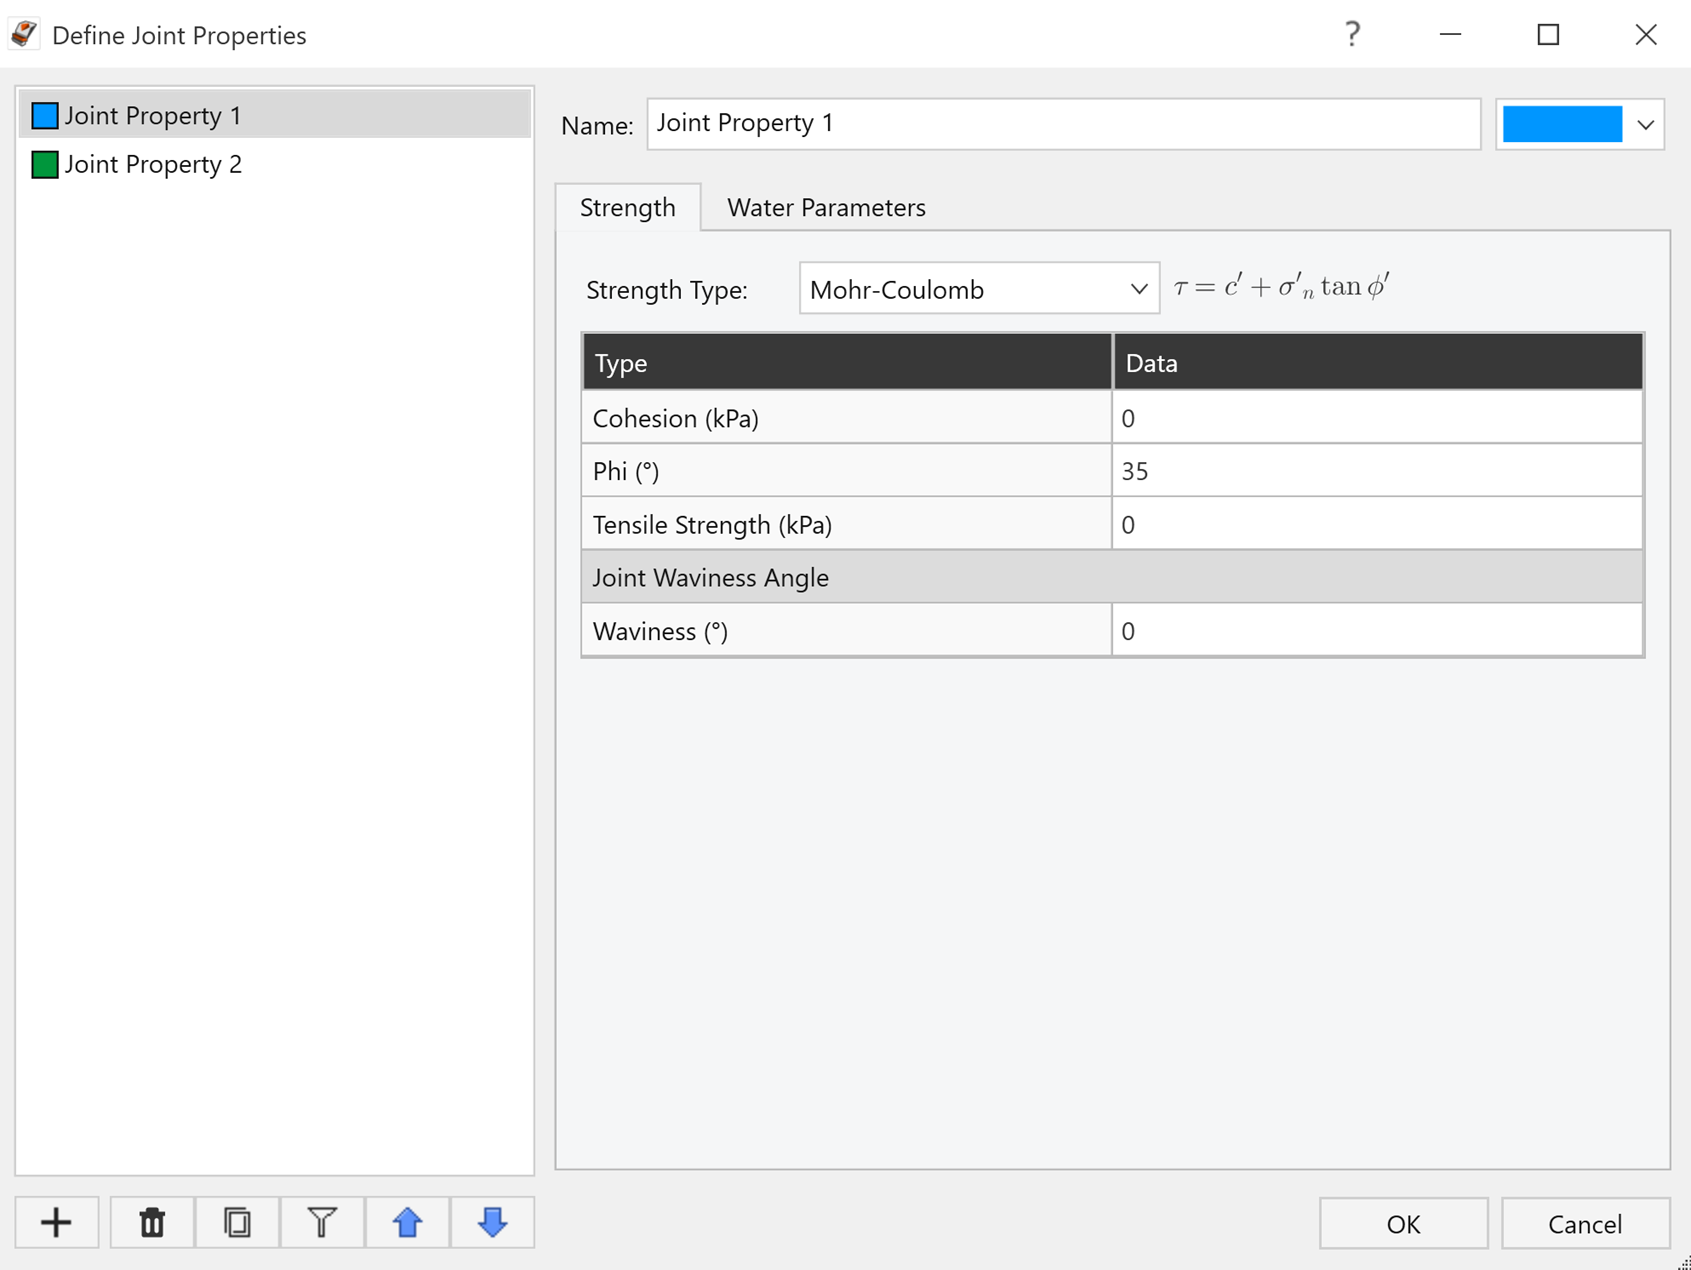
- Examine the Joint Property 1 strength parameters and ensure they are as follows:
- Cohesion (kPa) = 0
- Phi (°) = 35
- Waviness (º) = 0
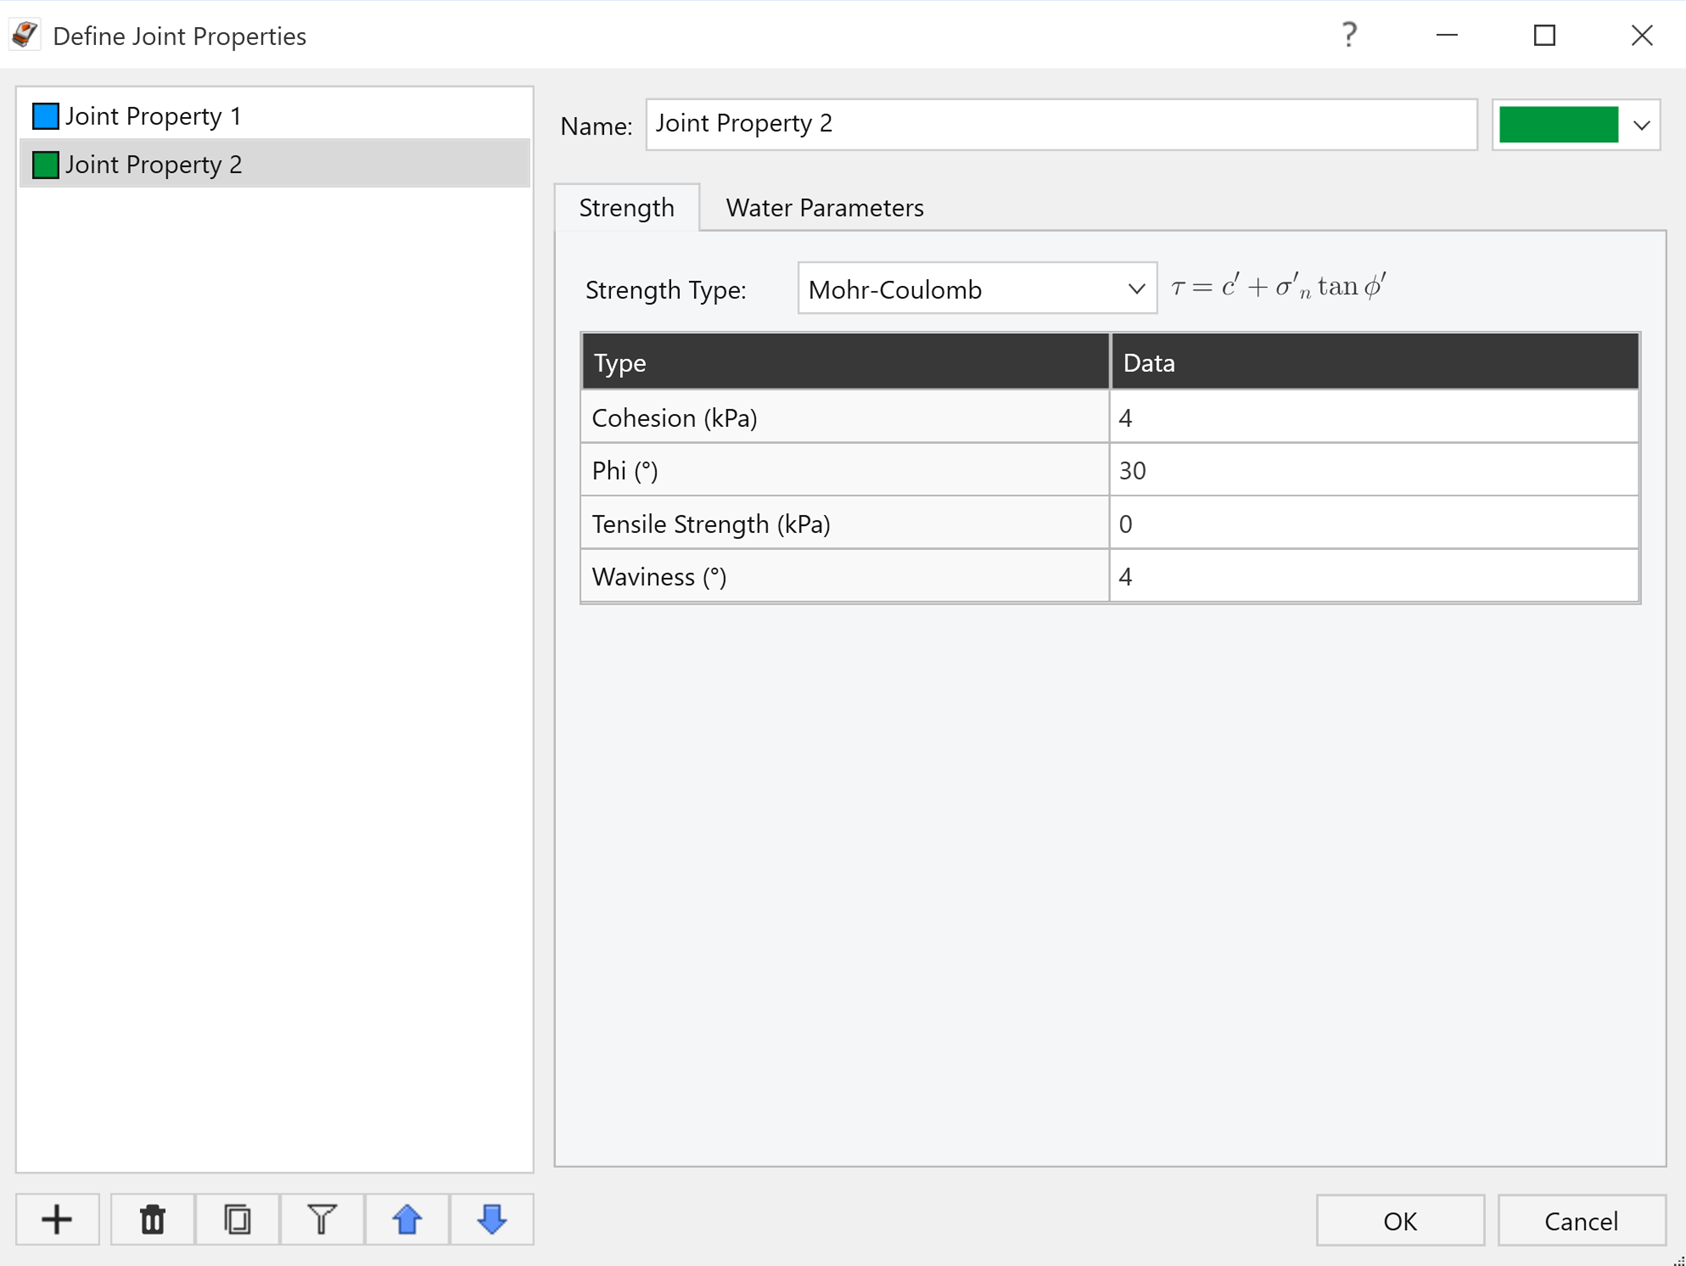
- Select Joint Property 2 and enter the following data:
- Cohesion (kPa) = 4
- Phi (º) = 30
- Waviness (º) = 4
- Click OK to apply the changes and close the dialog.
3.5 Joint Orientations
- Select Home > Joints > Orientations

- Click the Import DIPS
 button.
 - Select the provided Tutorial 2.dipsresults DIPS file.
- For Planes to Import, ensure that Grid Data is selected. This will import all the joint grid data in our DIPS file.
- Deselect the Preserve joint sets defined in DIPS checkbox in the Import Settings dialog, since the DIPS file we are importing does not include any defined joint sets. This will import all the joints in DIPS Grid Data into Joint Set 1.
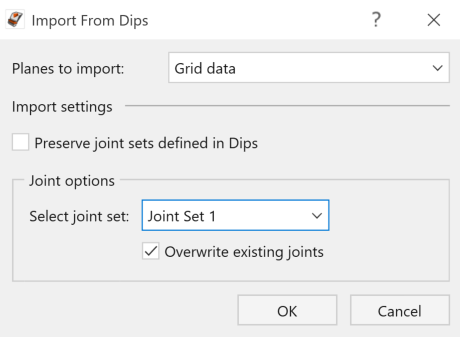
RocSlope2 Import from DIPS dialog - Click OK. Joint Orientations are now imported into Joint Set 1 in the dialog.
- Select the first 15 rows of joints using Shift or Ctrl keys.
- Click the Assign Joint Property button to assign a new joint property to the selected joints.
- Select Joint Property 2 to assign this joint property to the selected joints.
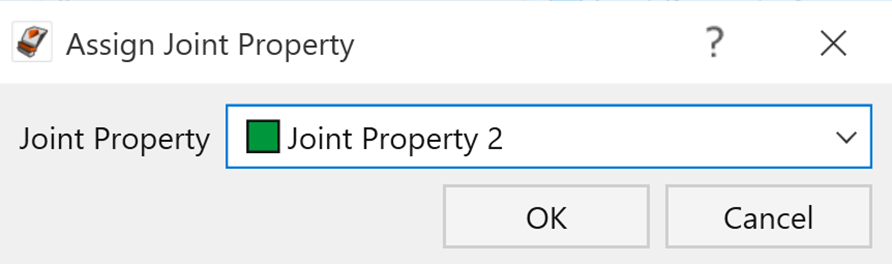
RocSlope2 Assign Joint Property dialog - Click OK and see that Joint Property 2 is now assigned to the selected joints.
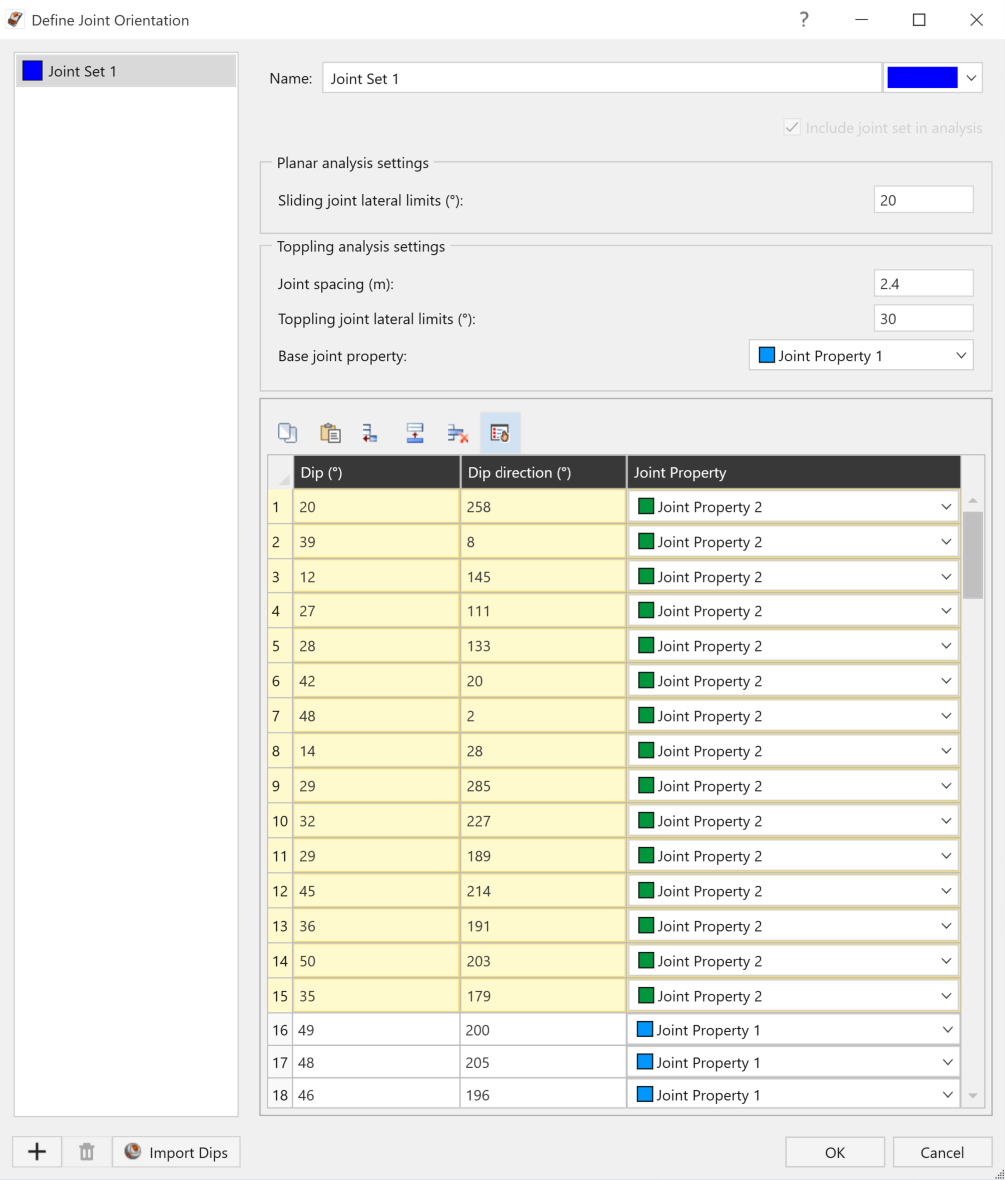
RocSlope2 Define Joint Orientations dialog - Leave all other parameters as is. Click OK to apply the changes and close the dialog.
Notice that the Wedge, Planar and Toppling analyses are conducted, and Factor of Safety values are computed instantly.
4.0 Stereonet View
The Stereonet View in RocSlope2 displays a stereographic projection of joint orientations in your model's input data (Slope Face, Upper Slope Face, Joints).
To open the Stereonet View:
- Click Home > Stereonet > Open
 on the toolbar.
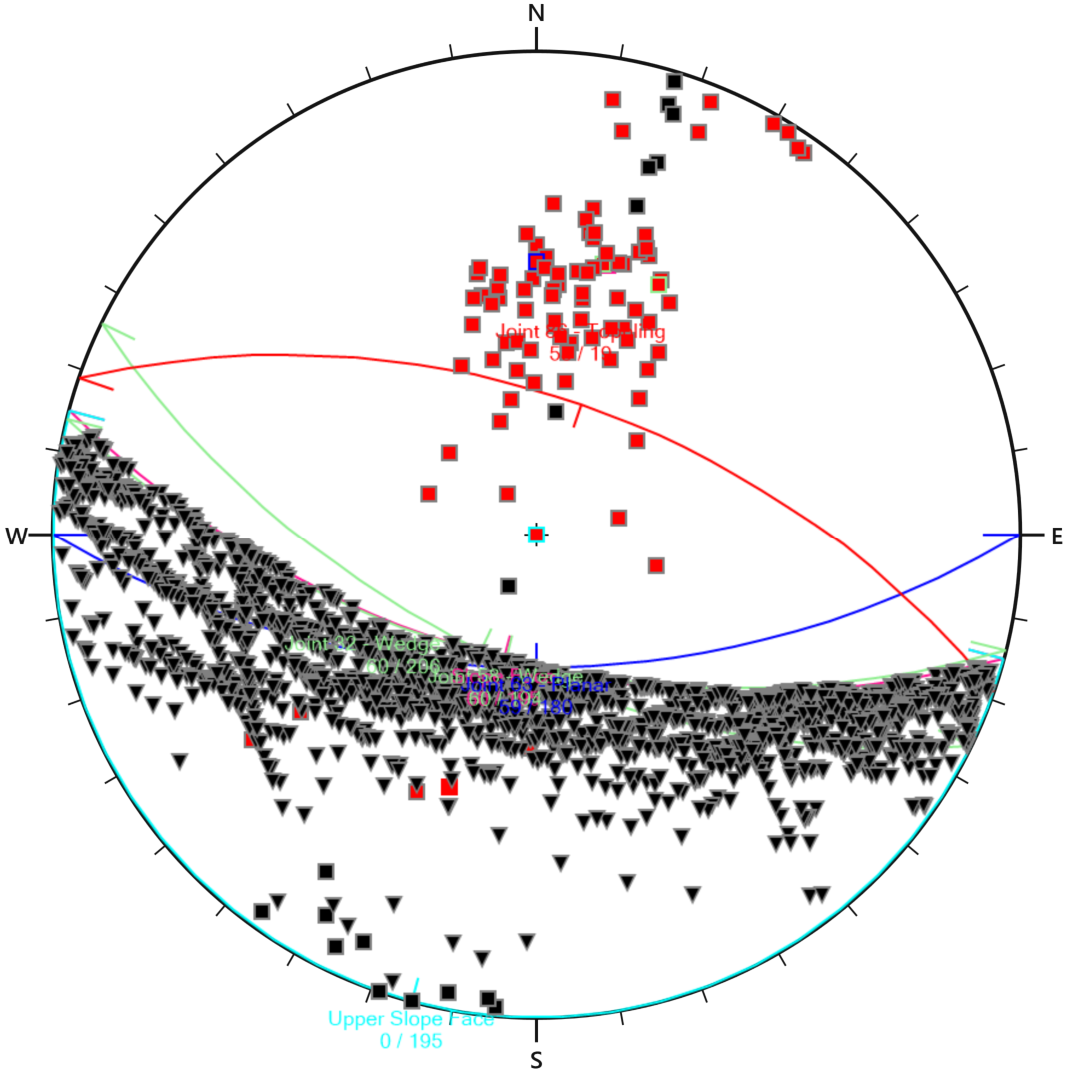
- To display/hide the legend, right-click on anywhere off the stereonet view and select Show Legend.
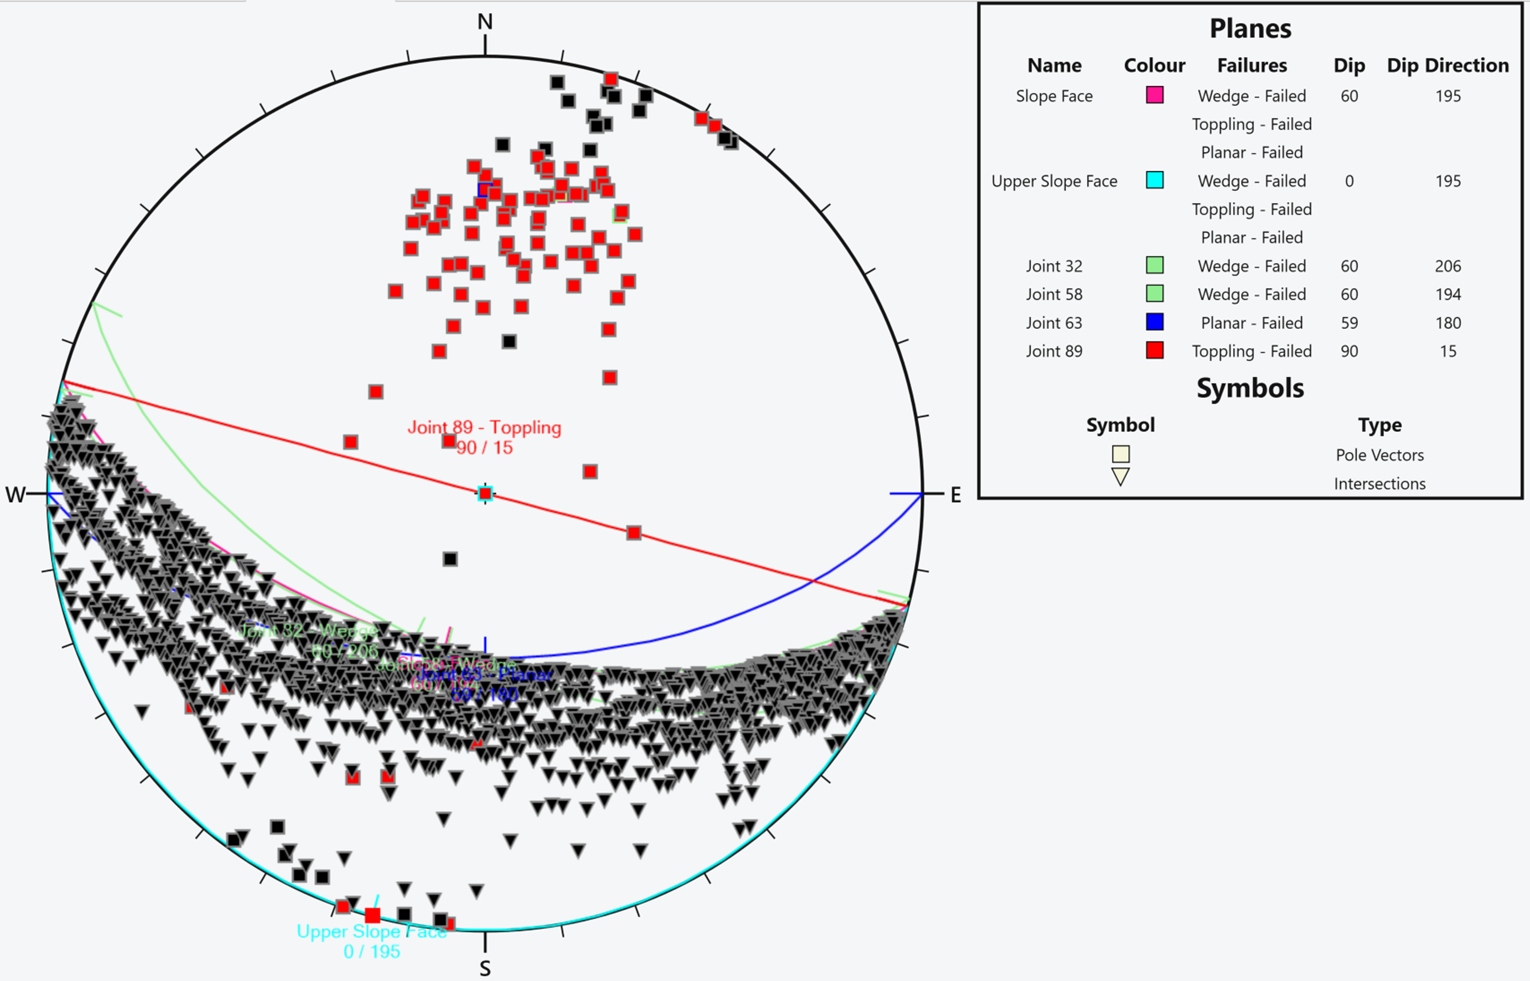
To set other viewing options (e.g., Show Planes, Show Poles, Show Intersections, Show Failures, Stereonet Projections, Show Grid Lines), right-click on anywhere off the stereonet view and select corresponding option. You can also set these options in the Stereonet Display Options dialog by selecting the Stereonet Options  icon. Pole Vector and Intersection symbols can also be changed in the Stereonet Display Options dialog.
- To restore the split-screen view in RocSlope2 click on the All Analyses
 icon, or click Close
  to close the Stereonet View.
5.0 Wedge, Planar and Toppling Results
The lowest Factor of Safety and the corresponding block geometry are displayed at each analysis pane for the corresponding analysis method by default. Notice that the corresponding Block IDs for the blocks with the lowest Factor of Safety for each analysis method are also automatically displayed at the bottom left corner in each analysis pane.
You should see the Wedge Analysis with a Factor of Safety of 0.408, Planar Analysis with a Factor of Safety of 0.421 and Toppling Analysis with a Factor of Safety of 0.838.
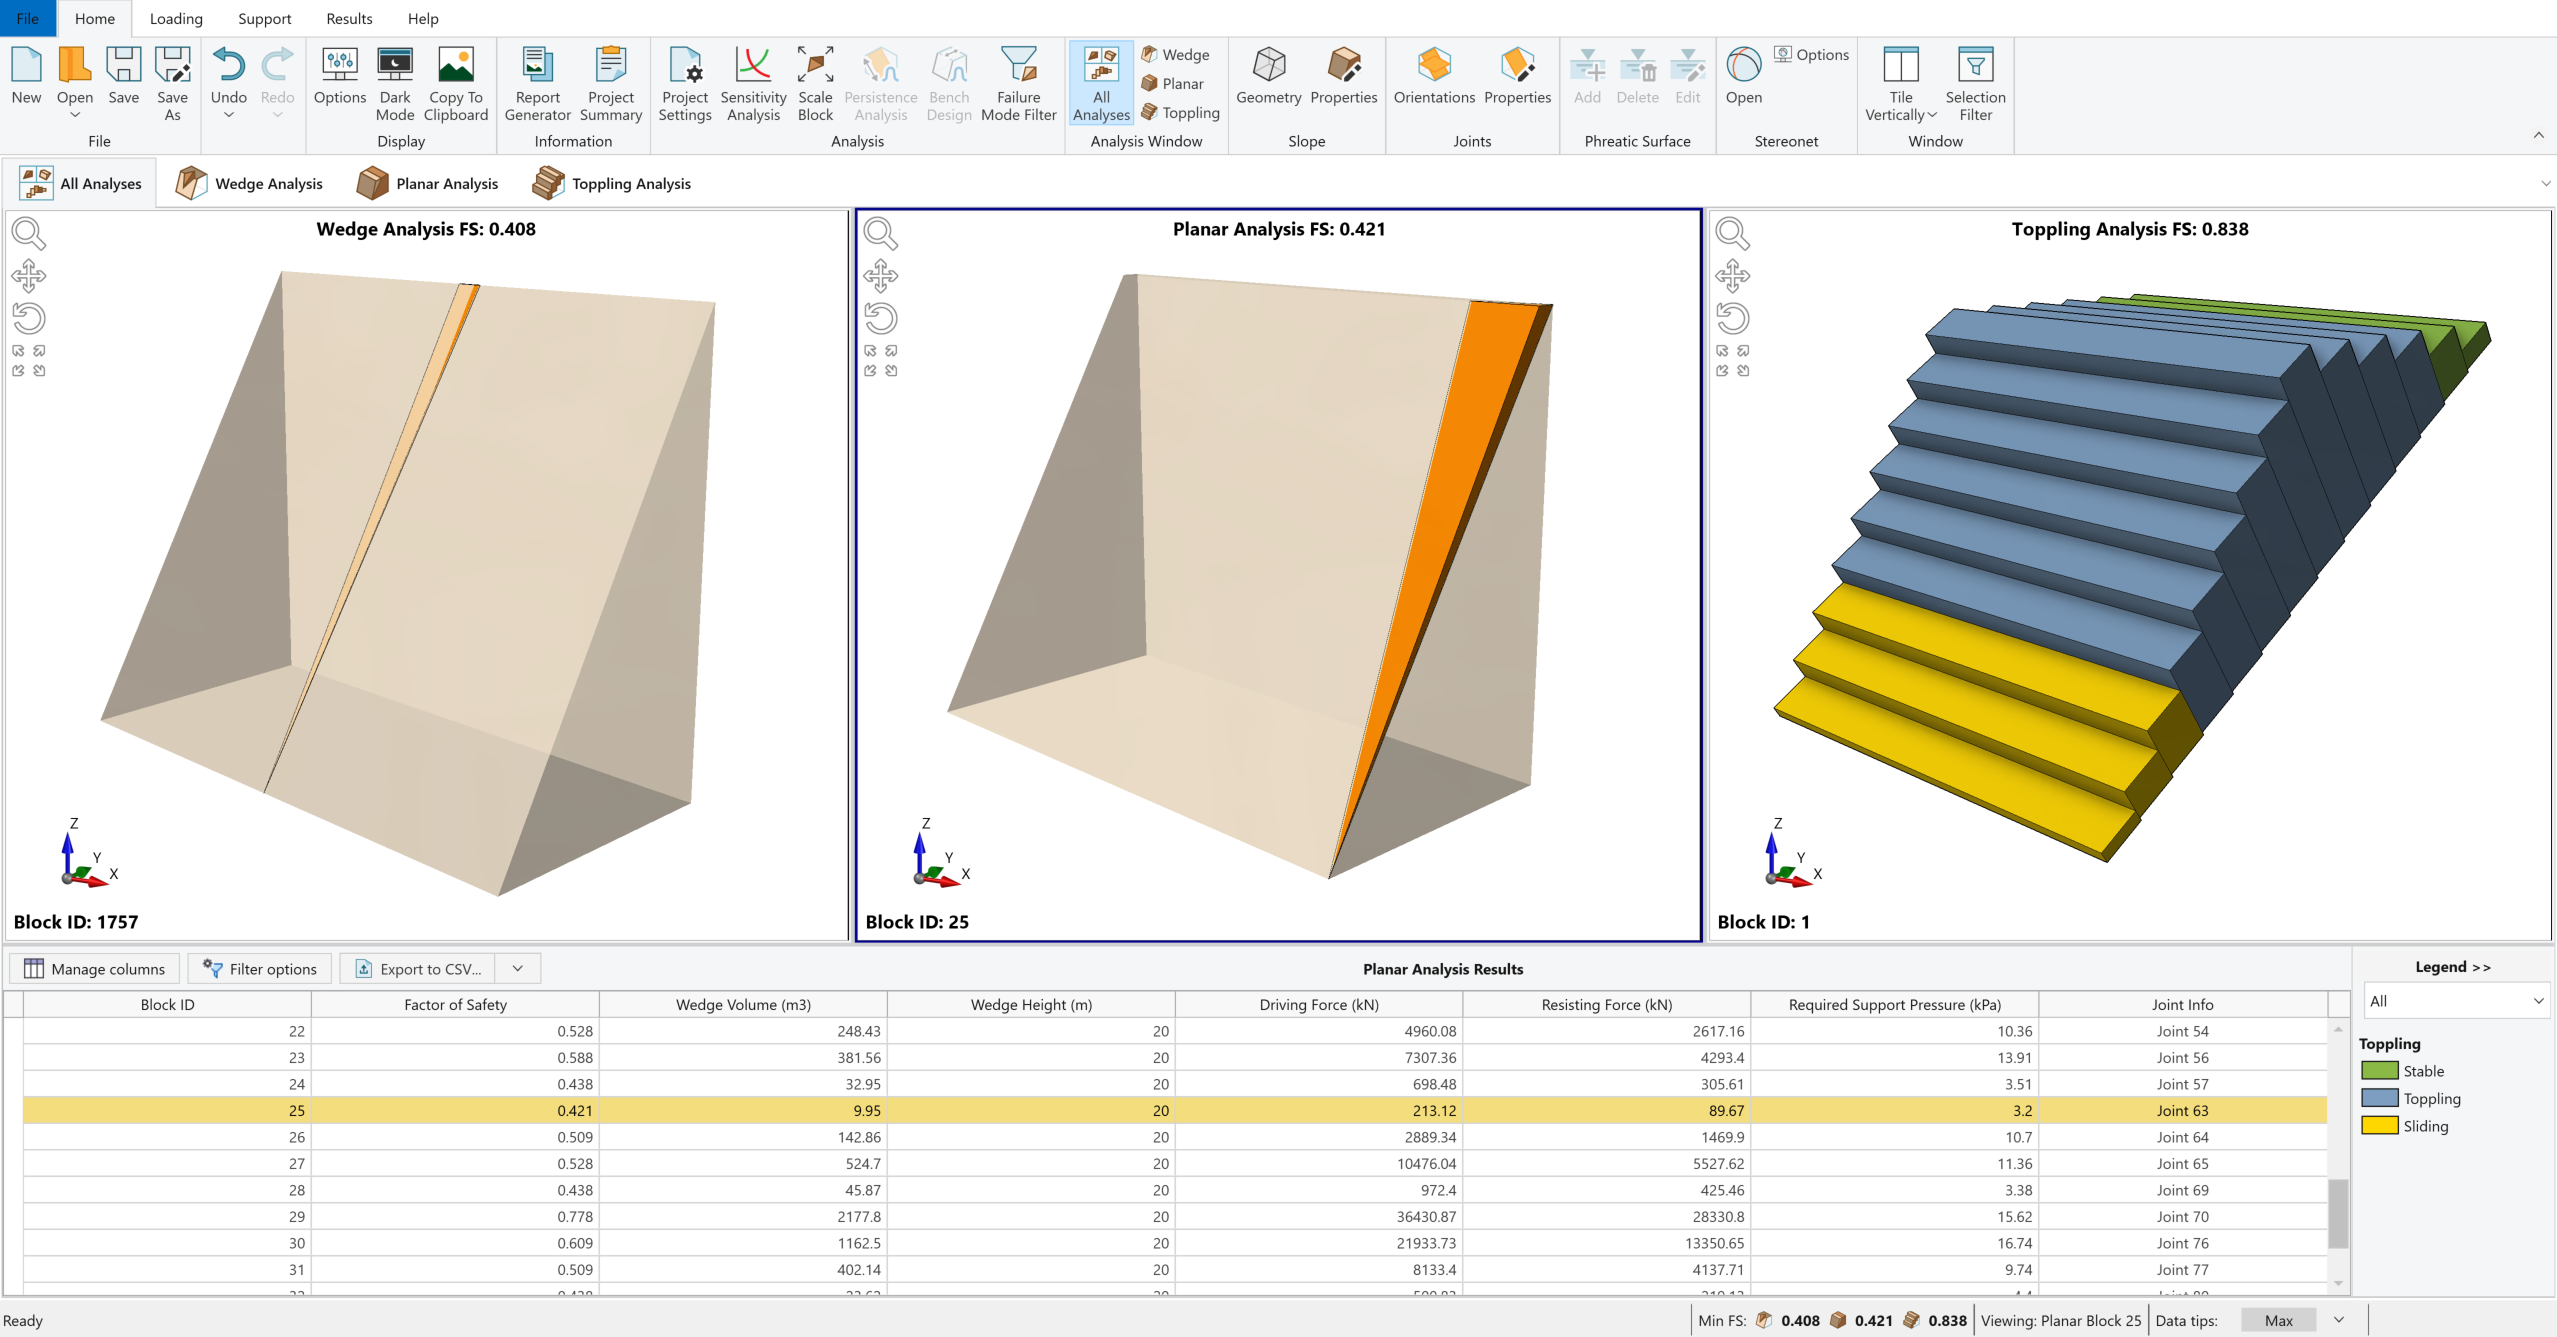
The Wedge Information (Volume, Area, Weight, etc.), Driving and Resisting Forces and Factor of Safety values are also listed in Results Grid for all valid blocks formed and computed. Double click on any row in the Results Grid for the Wedge, Planar or Toppling analysis results to see the formed wedge/block geometry and the corresponding Factor of Safety.
- Navigate to Results tab to see more result viewing and interpretation options available in RocSlope2.
5.1 Show Min. FS Result
As mentioned above, RocSlope2 displays the lowest Factor of Safety and the corresponding block geometry for each analysis method every time the Factor of Safety values are recomputed.
To see the block geometry with the lowest Factor of Safety among all blocks listed in Results Grid after examining other blocks’ results and details:
- Click Results > Results > Show Min. FS Result

This will reset the block views and the blocks with the lowest Factor of Safety for each analysis method will be automatically displayed in split-screen view.
TIP: The Status Bar at the bottom of the RocSlope2 model interactively displays the min. FS values for each analysis method at all times.
TIP: The columns in the Results Grid can be reordered to reflect ascending or descending order (i.e. lowest to highest FS) by clicking the heading of the corresponding column.
5.2 Show Results Grid
- Click Results > Results > Show Results Grid
 to hide the Results Grid and maximize analysis panes.
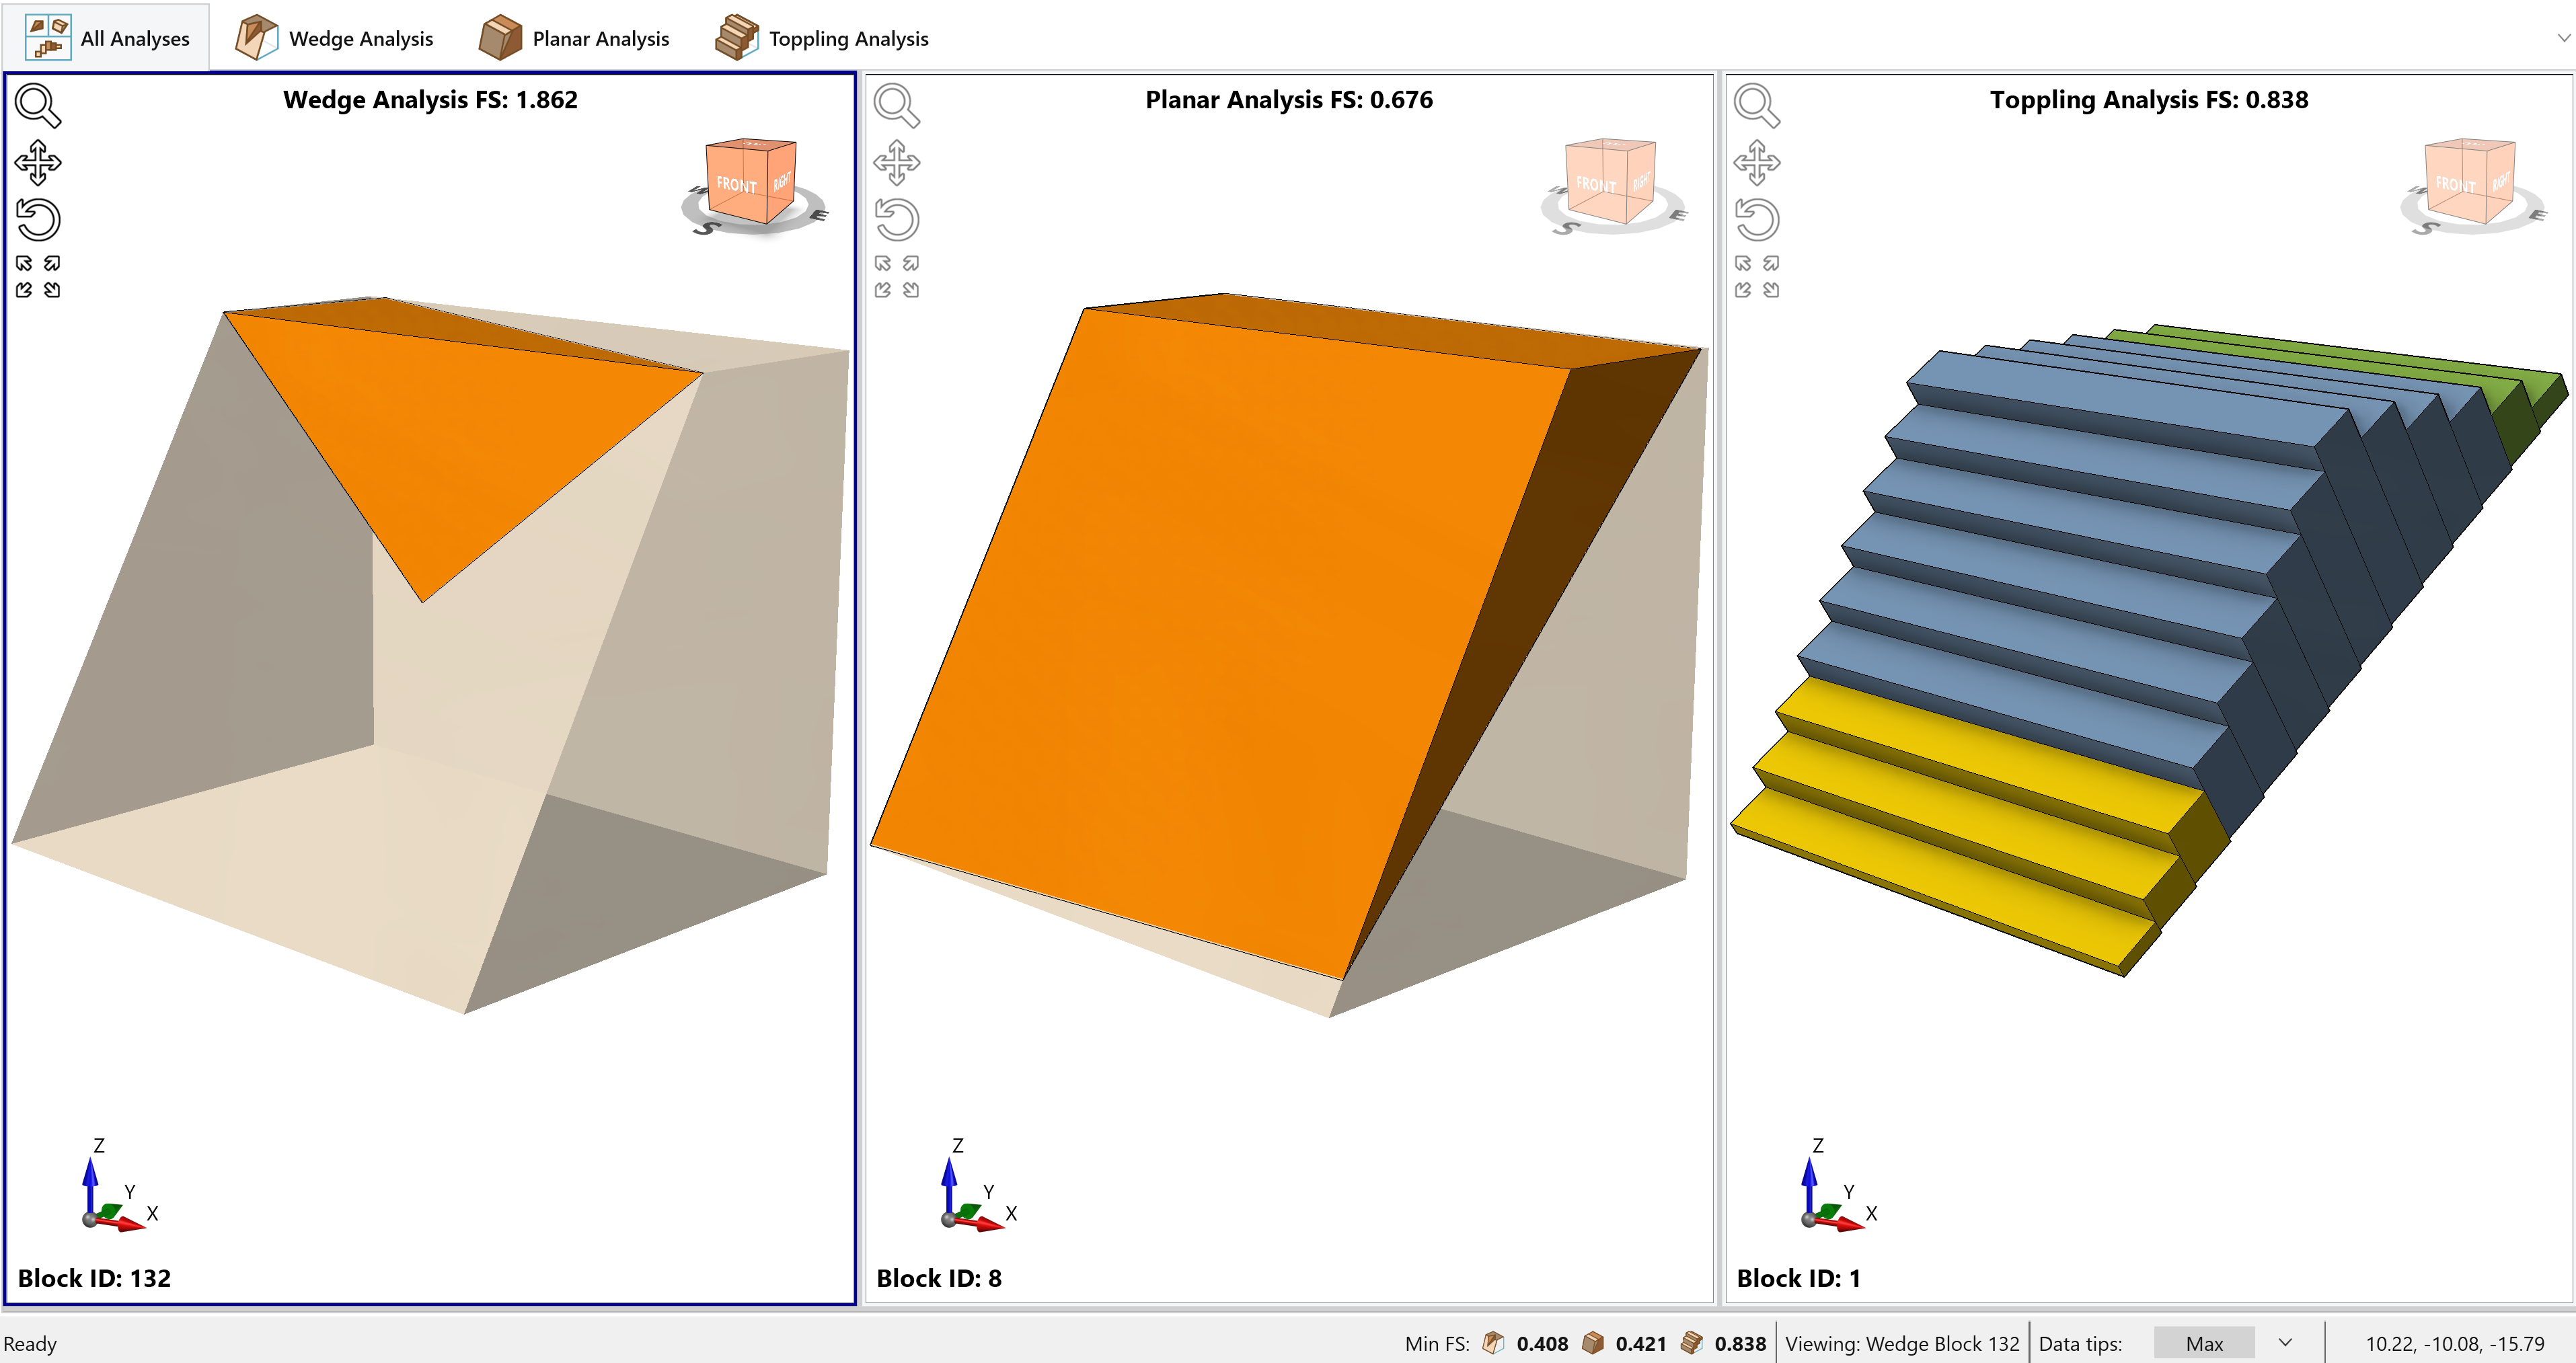
RocSlope2 - Results Grid turned off - Click the Show Results Grid button again to show the Results Grid.
5.3 Histograms
You can plot a histogram of results using the Histogram option under Results tab.
- Select Results > Charts > Histogram
 on the toolbar.
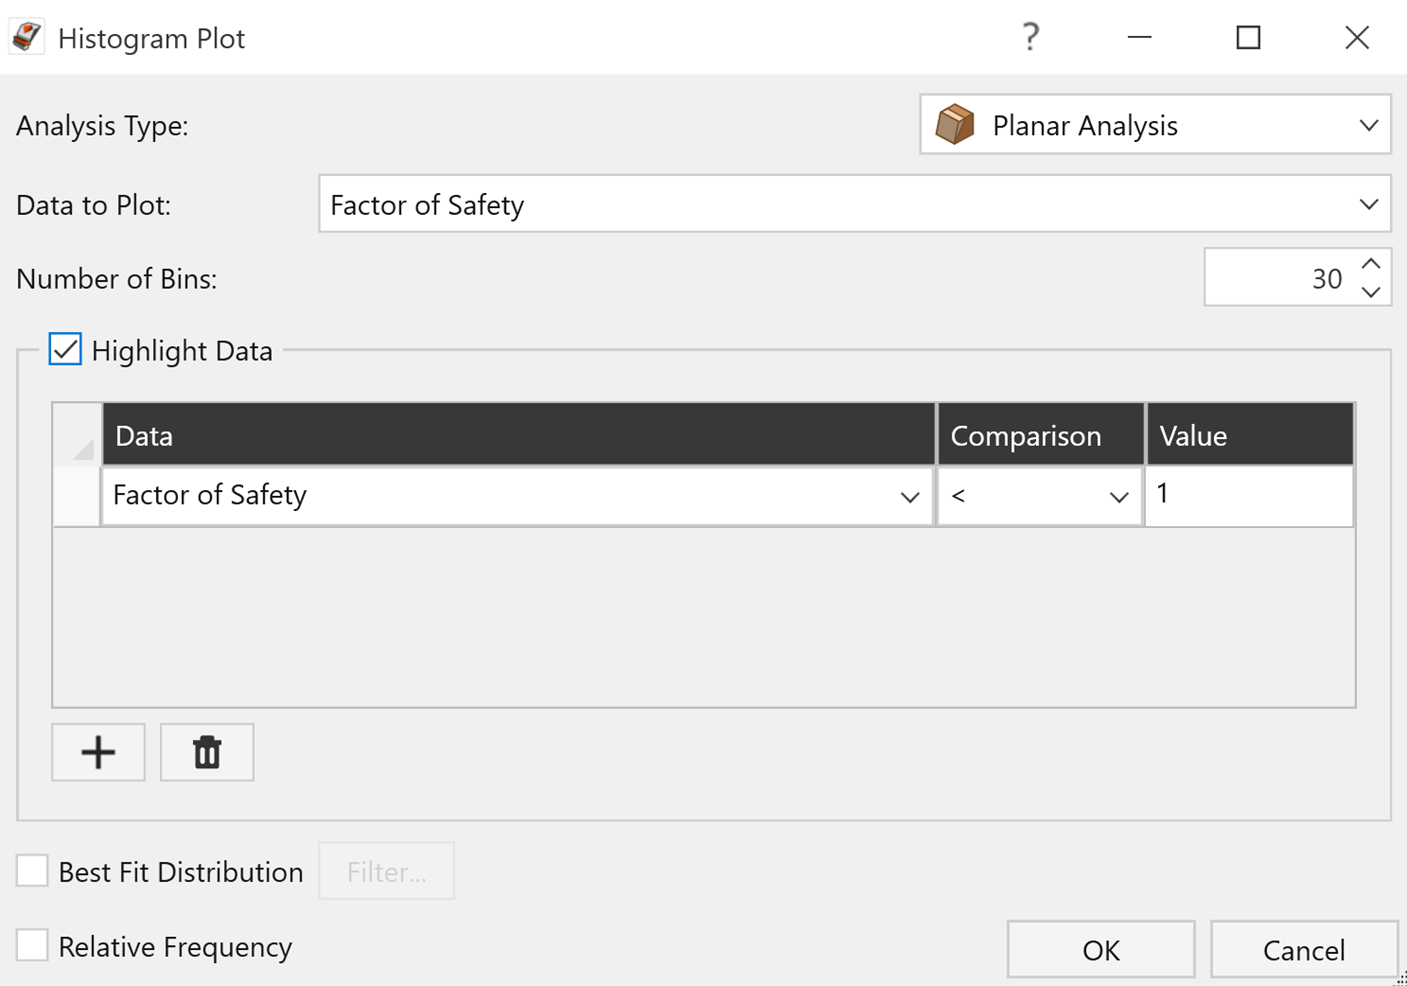
- The Analysis Type is set to the current Analysis Pane selection and the Data to Plot is set to Factor of Safety by default.
- Set Analysis Type = Planar Analysis.
- Leave Number of Bins = 30.
- Select the Highlight Data checkbox and leave the Factor of Safety to <1.
- Click OK.
A histogram of the Factor of Safety is displayed in the Histogram View.
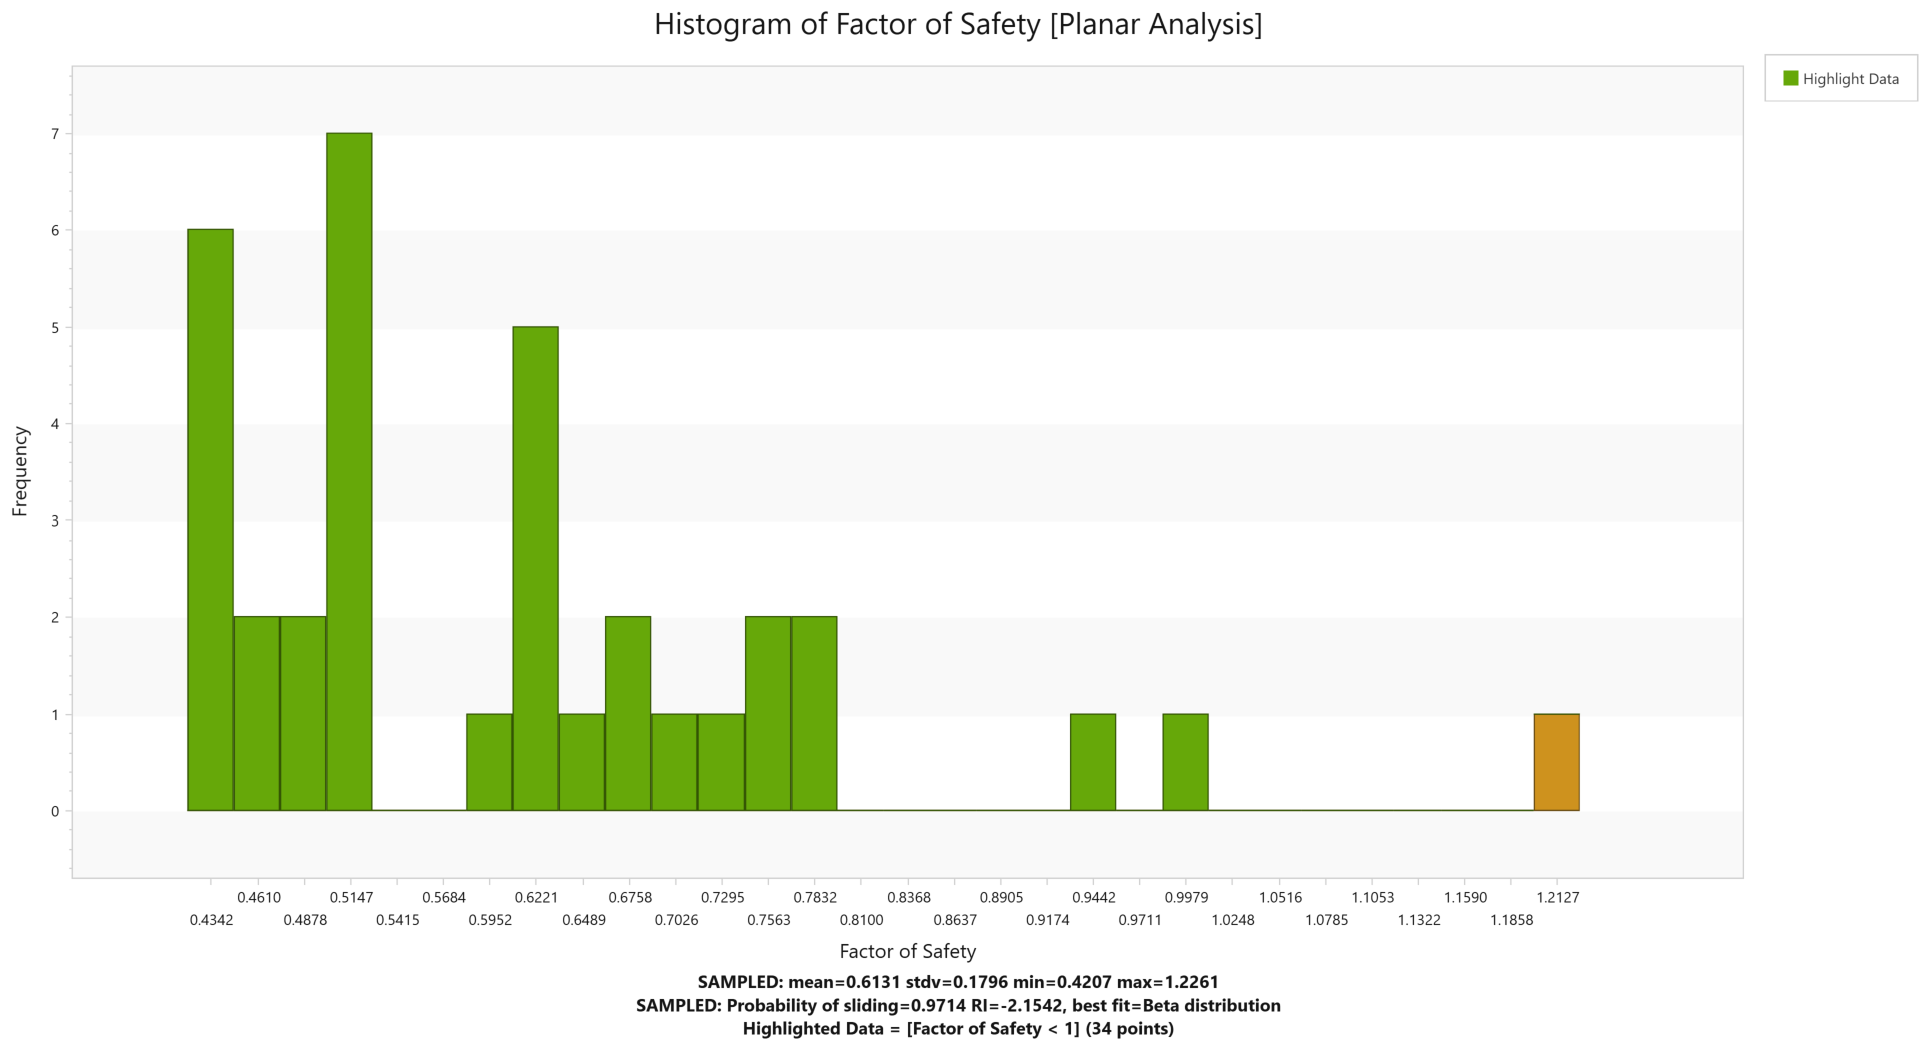
The histogram represents the distribution of the Planar Analysis Factor of Safeties for all valid blocks generated by the possible combination of joint orientations input data. The green bars to the left represent blocks with a Factor of Safety of less than 1.0 while the orange bar to the right represent block with a Factor of Safety greater than 1.0.
In addition to the Factor of Safety, you can plot histograms of various data (i.e. wedge information, forces, stresses, etc.).
5.4 Scatter Plots
Scatter plots allow you to examine the relationship between any two analysis variables. You can generate a scatter plot of results using the Scatter option under Results tab.
- Select Results > Charts > Scatter
 on the toolbar.
 - In the Scatter Plot dialog, set Analysis Type = Planar Analysis.
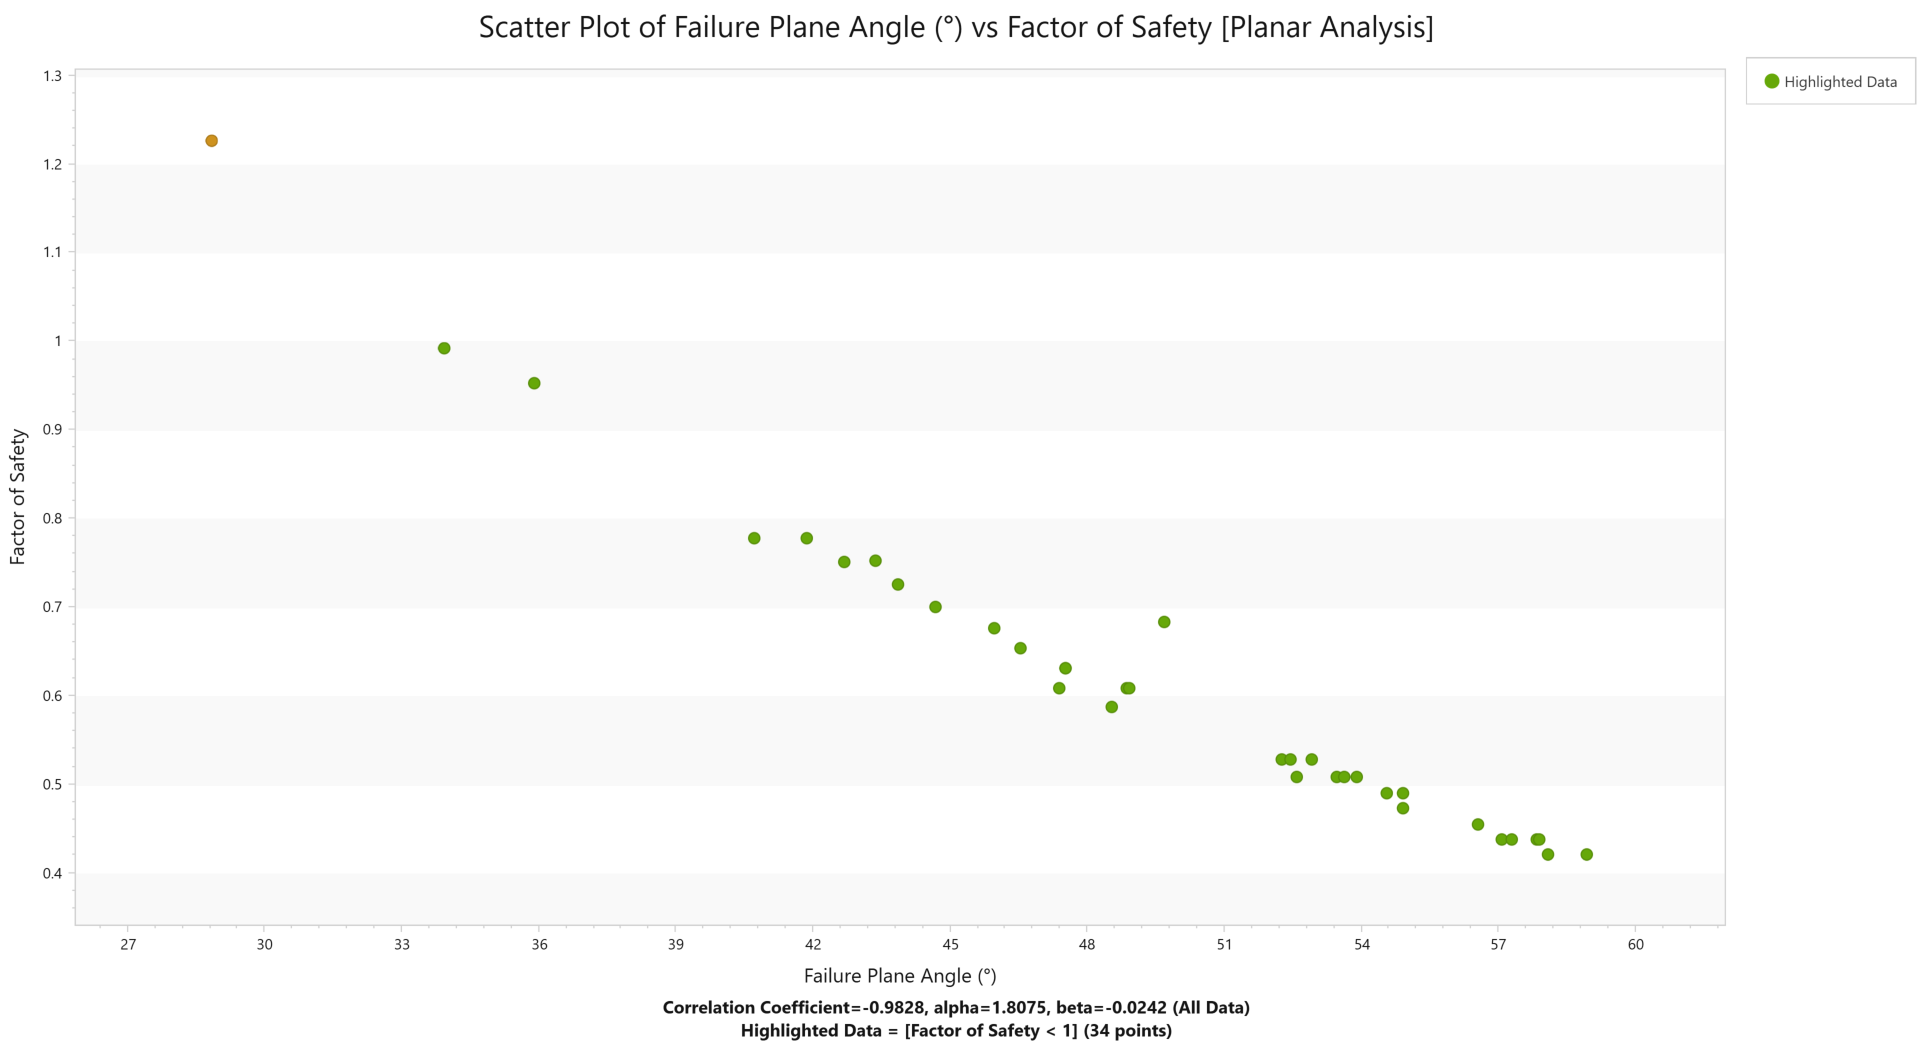
- Select the variables you would like to plot on the X and Y axes. For example, let's plot the Failure Plane Angle () (X Axis Dataset) versus the Factor of Safety (Y Axis Dataset).
- Select the Highlight Data checkbox and leave the Factor of Safety to <1.
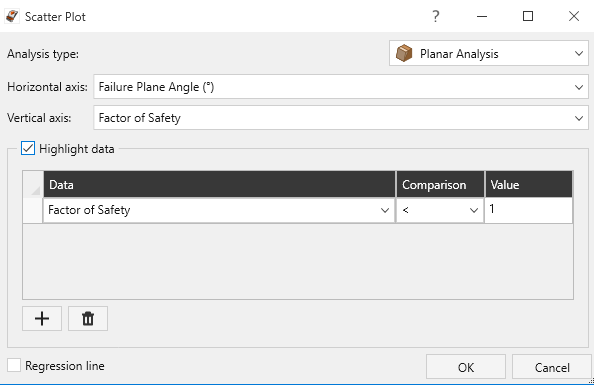
RocSlope2 Scatter Plot dialog - Click OK to generate the scatter plot.
A scatter plot of the Failure Plane Angle (°) vs. the Factor of Safety for Planar Analysis is displayed in the Scatter Plot View.
To fit a line of regression to the scatter plot:
- Click Regression Line on the toolbar under the Chart tab in the Scatter Plot View.
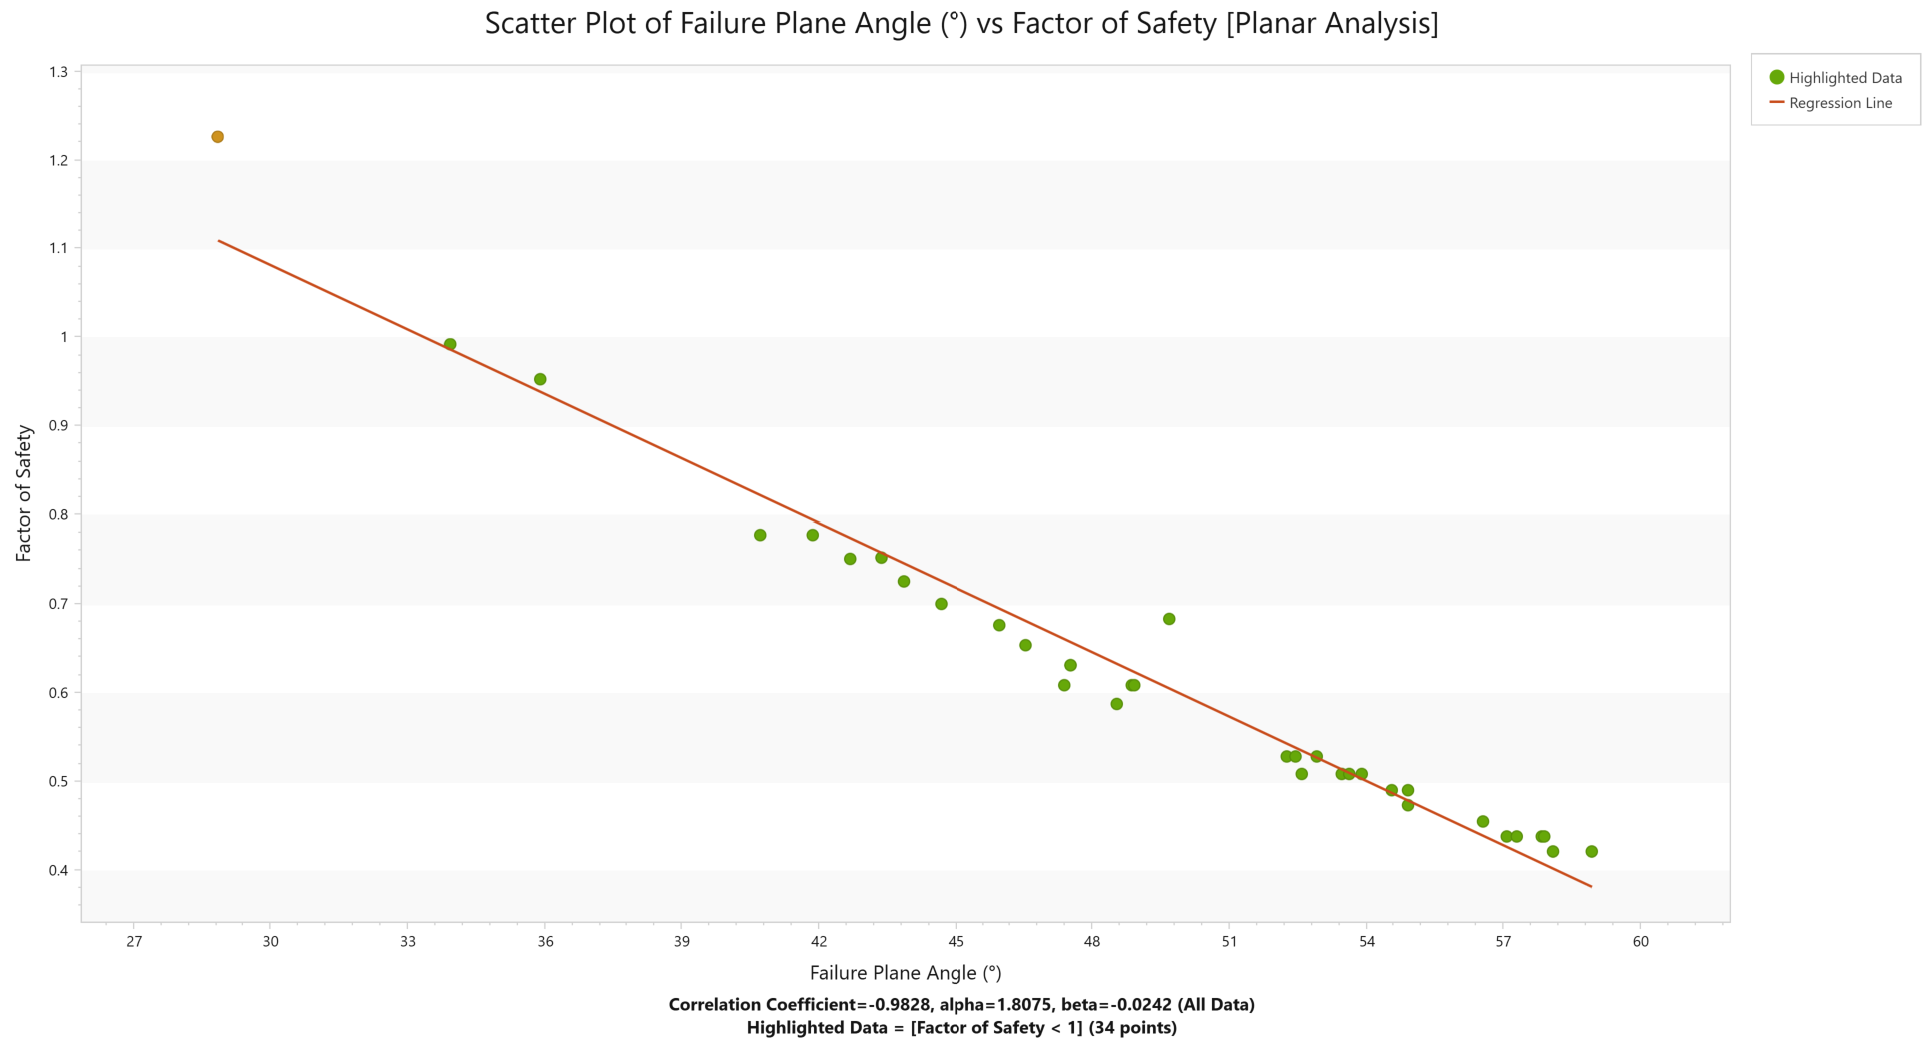
The alpha and beta values of the regression line are shown at the bottom of the plot.
Note the following:
- The alpha value (1.8075) represents the y-intercept of the linear regression line on the scatter plot.
- The beta value (-0.0242) represents the slope of the linear regression line.
- The Correlation Coefficient (-0.9828) indicates the degree of correlation between the two variables plotted. This value varies between -1 and 1, where a number close to 0 indicates a poor correlation, and a number close to 1 or -1 indicates a good correlation. A negative Correlation Coefficient indicates the slope of the regression line is negative.
This concludes the tutorial. You are now ready for the next tutorial, Tutorial 3 - Water Pressure.