Fisher Distribution
A Fisher Distribution is commonly used for modelling the distribution of 3-dimensional orientation vectors (Fisher, 1953), such as the distribution of joint orientations (pole vectors) on a sphere. A Fisher Distribution describes the angular distribution of orientations about a mean orientation vector and is symmetric about the mean. The probability density function can be expressed as:
Where:
- θ = angular deviation from the mean vector, in degrees
- K = "Fisher constant" or dispersion factor
In RocSlope3, a Fisher Distribution can be used to define statistical joint orientation.
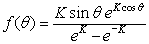
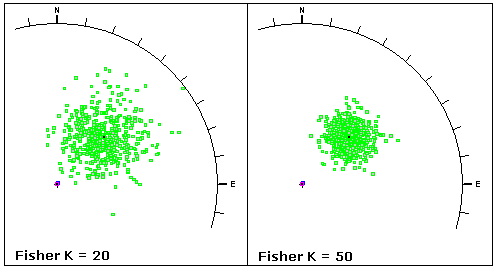
Fisher K
The Fisher K value describes the tightness or dispersion of an orientation cluster. A larger K value (e.g. 50) implies a tighter cluster, and a smaller K value (e.g., 20) implies a more dispersed cluster, as shown in the following figure.
The Fisher K value can be estimated from Eqn. 2, for data sets with greater than approximately 30 vectors (poles) (Fisher, 1953).

Where:
- N = number of poles
- R = magnitude of the resultant vector (i.e., the magnitude of the vector sum of all pole vectors in the set)
Standard Deviation
By analogy with a Normal Distribution, it can be shown that the standard deviation of a Fisher Distribution can be estimated from Eqn.3 (Butler, 1992).

Where:
- θ = "angular standard deviation" or "angular dispersion" of the Fisher Distribution
- K = Fisher constant