Contour Options
The Contour Options dialog allows the user to adjust the range and colour format of the displayed contours for their results.
To access the Contour Options:
- Select Interpret > Contour Options in the menu or click on the Contour Options
 icon in the toolbar.
 - Set Contour Range and Colour Table options.
- Click OK to close the dialog.
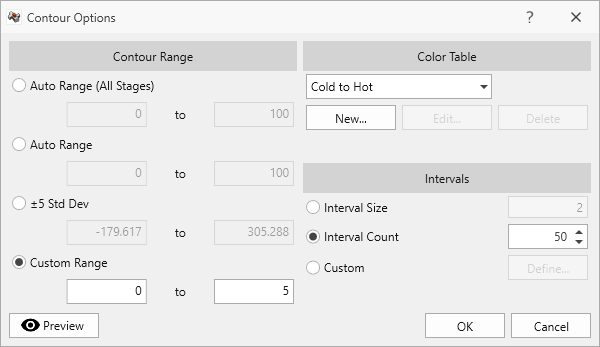
Contour Range
- Auto Range (All Stages): Allows RocTunnel3 to automatically define range of contour based on values computed for all stages.
- Auto Range: Allows RocTunnel3 to automatically select the range of values for contour based on values computed in the current stage.
- Std Dev: Allows you to define range of standard deviation of plus/minus the range of standard deviation for contour range.
- Custom Range: Allows you to define the range of the contour with user-defined values.
Intervals
- Interval Size: Defines the interval range of the contour to be displayed.
- Interval Count: Defines the number of intervals of the contour range to be displayed in the model.
- Custom: You can customize the colors with the interval of interest.
Colour Table
RocTunnel3 offers users a variety of preset contour colour options. Use the drop down menu to select one of the below colour maps, then click Apply All.
- 16 Colour Display
- DOS Style
- Hot to Cold
- Cold to Hot
- Hot Spots
- Black to White
- Example 3D
- Turbo colour
The Turbo Colour option provides smoother and more visually accurate contours for representing the data, as well as an option that is more distinguishable to our eyes. More explanation on improved rainbow color map for visualization is provided here.
Creating a New Custom Colour Map
To create a custom colour map:
- Select the New button to create a custom colour map.
- The Define Colours dialog allows users to select the Minimum/Maximum Colours, Interpolation Method and more.
- Click OK to save the custom colour map.