Adding Support
1.0 Introduction
This model represents a horseshoe shaped tunnel with approximately 5-meter span, to be excavated in heavily jointed rock. The rock is described as blocky/seamy, of poor quality, and will require support to prevent collapse.
In this first step of the Support tutorial (Section 2 and 3), the model is analyzed without support. Both elastic and plastic analyses are performed.
In the second part of the tutorial (Sections 4 and 5), the model is analyzed with various forms of support:
- Bolts only
- Bolts and shotcrete
- Bolts and shotcrete in conjunction with load splitting

2.0 Compute
- Select: File > Recent Folders > Tutorial Folder and select the Adding Support Part 1 Elastic file from the Support folder.
- Select: Analysis > Compute

3.0 Results and Discussion Part 1: Elastic and Plastic (no support)
- Select: Analysis > Interpret

- Let’s first view the strength factor contours. Select Strength Factor from the data type dropdown menu in the toolbar.
- To customize the contours and add some contour labels, right-click and select Contour Options.
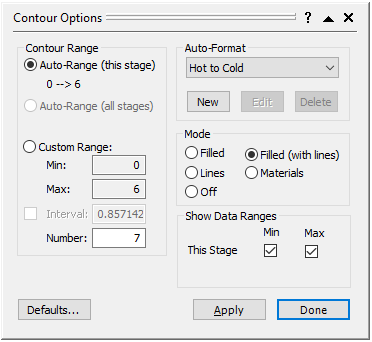
- In the Contour Options dialog, enter Number of Intervals = 7, Mode = Filled (with Lines), and select Done.
- Add some Contour Labels as shown in the figure below. Select Tools > Add Tool > Label Contour
 or click Label Contour
  in the toolbar. Click on a section of the model to add the label there. Repeat this to add as many labels as you need. Press the Esc key when done.
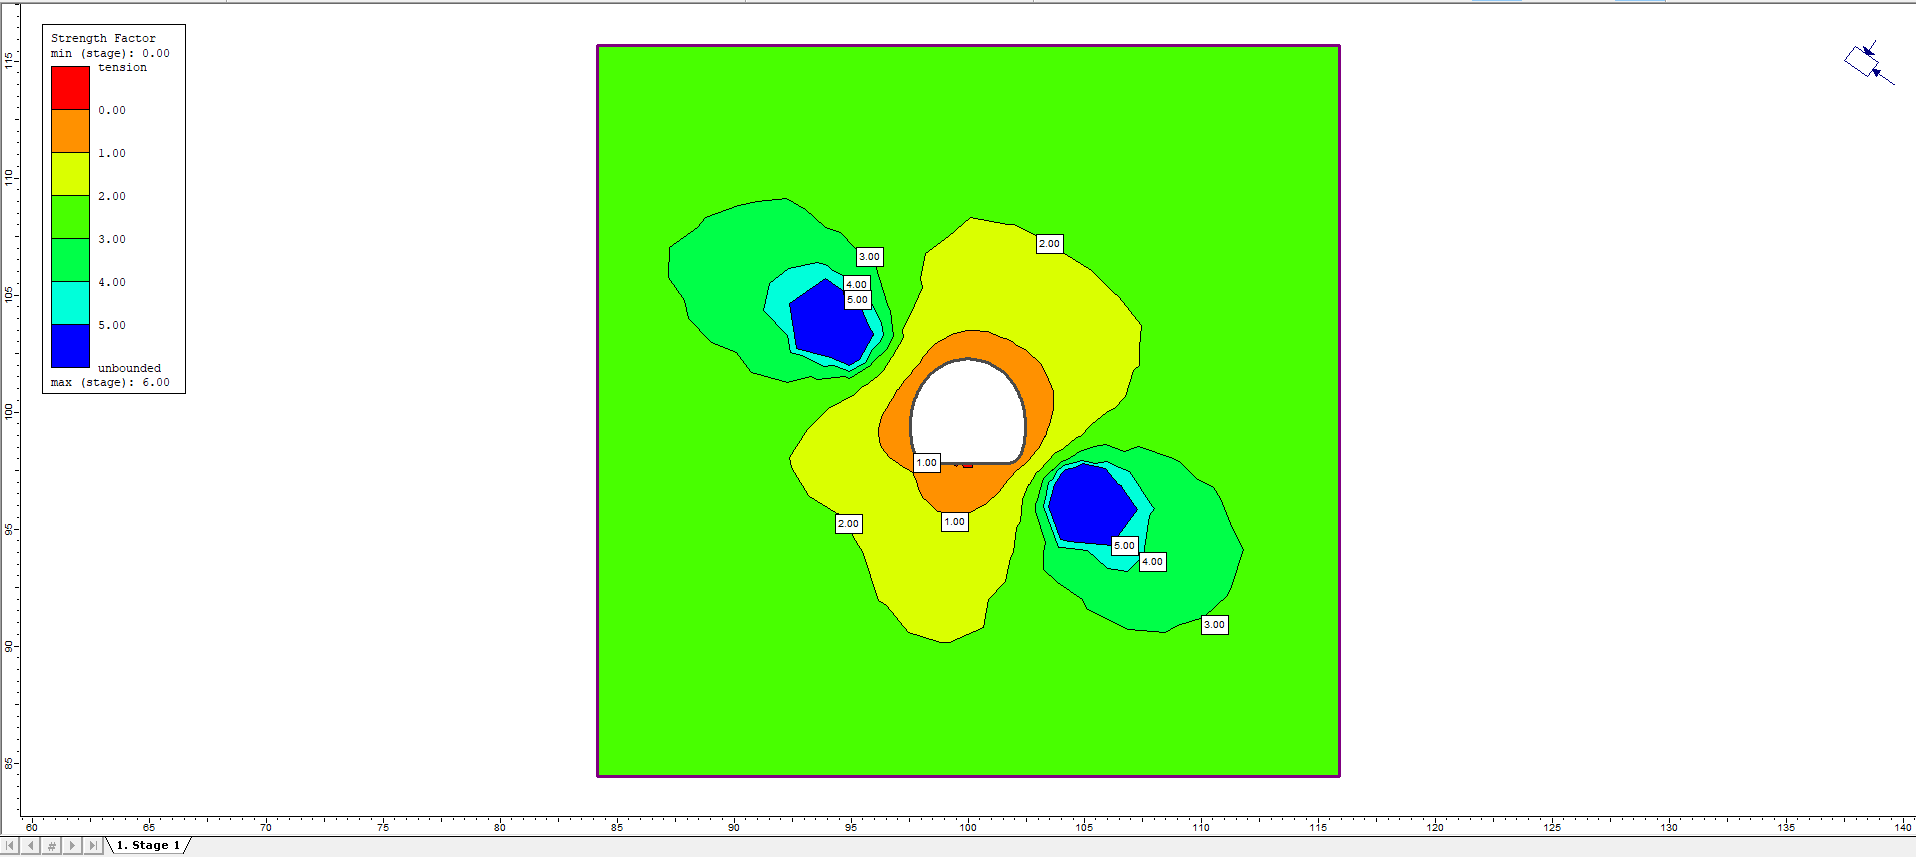
Strength factor represents the ratio of available rock mass strength to induced stress at a given point. There is a large zone of overstress surrounding the tunnel. All the rock within the contour marked 1 has a strength factor less than 1 (based on the elastic analysis results) and will fail if left unsupported.
- Select: Tools > Delete All Tools to delete the contour labels.
- Select Total Displacement from the data type dropdown menu in the toolbar.
Zoom in and toggle the displacement vectors on:
- Click Zoom Excavation
 in the toolbar (or select View > Zoom > Zoom Excavation from the menu)
 - Select: View > Display Options
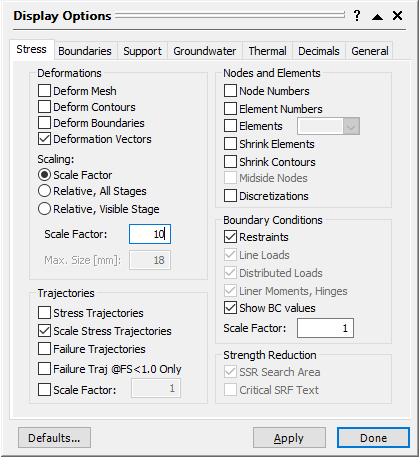
- In the Display Options dialog, toggle Deformation Vectors on.
- Enter a scale factor of 10 as follows, and select Done.

The elastic displacements show an inward displacement of the tunnel walls, as well as a significant floor heave. This elastic analysis shows that the region of overstress is significant.
3.1 Model (Plastic Analysis. no support)
Let’s define the rock mass to be plastic and re-run the analysis:
- Select: Properties > Define Materials


- Change the Material Type to Plastic. Enter residual “mb” and “s” parameters equal to the peak parameters; this defines the material as ideally elastic-plastic (i.e. no strength drop once yield is reached).
- Click OK.
- Save
 and Compute
  the model (Adding Support Part 1 Plastic), then open Interpret.
 - View the Strength Factor contours by selecting Strength Factor from the data type drop-down menu in the toolbar.
Notice the entire region around the excavation has a strength factor of approximately 1. For a plastic analysis, when failure (yielding) occurs, the strength factor is, by definition, equal to one, whereas in an elastic analysis, the strength factor can go below one as a hypothetical measure of overstress.
- Turn on Yielded Elements
 to view the failure zone in a plastic model.
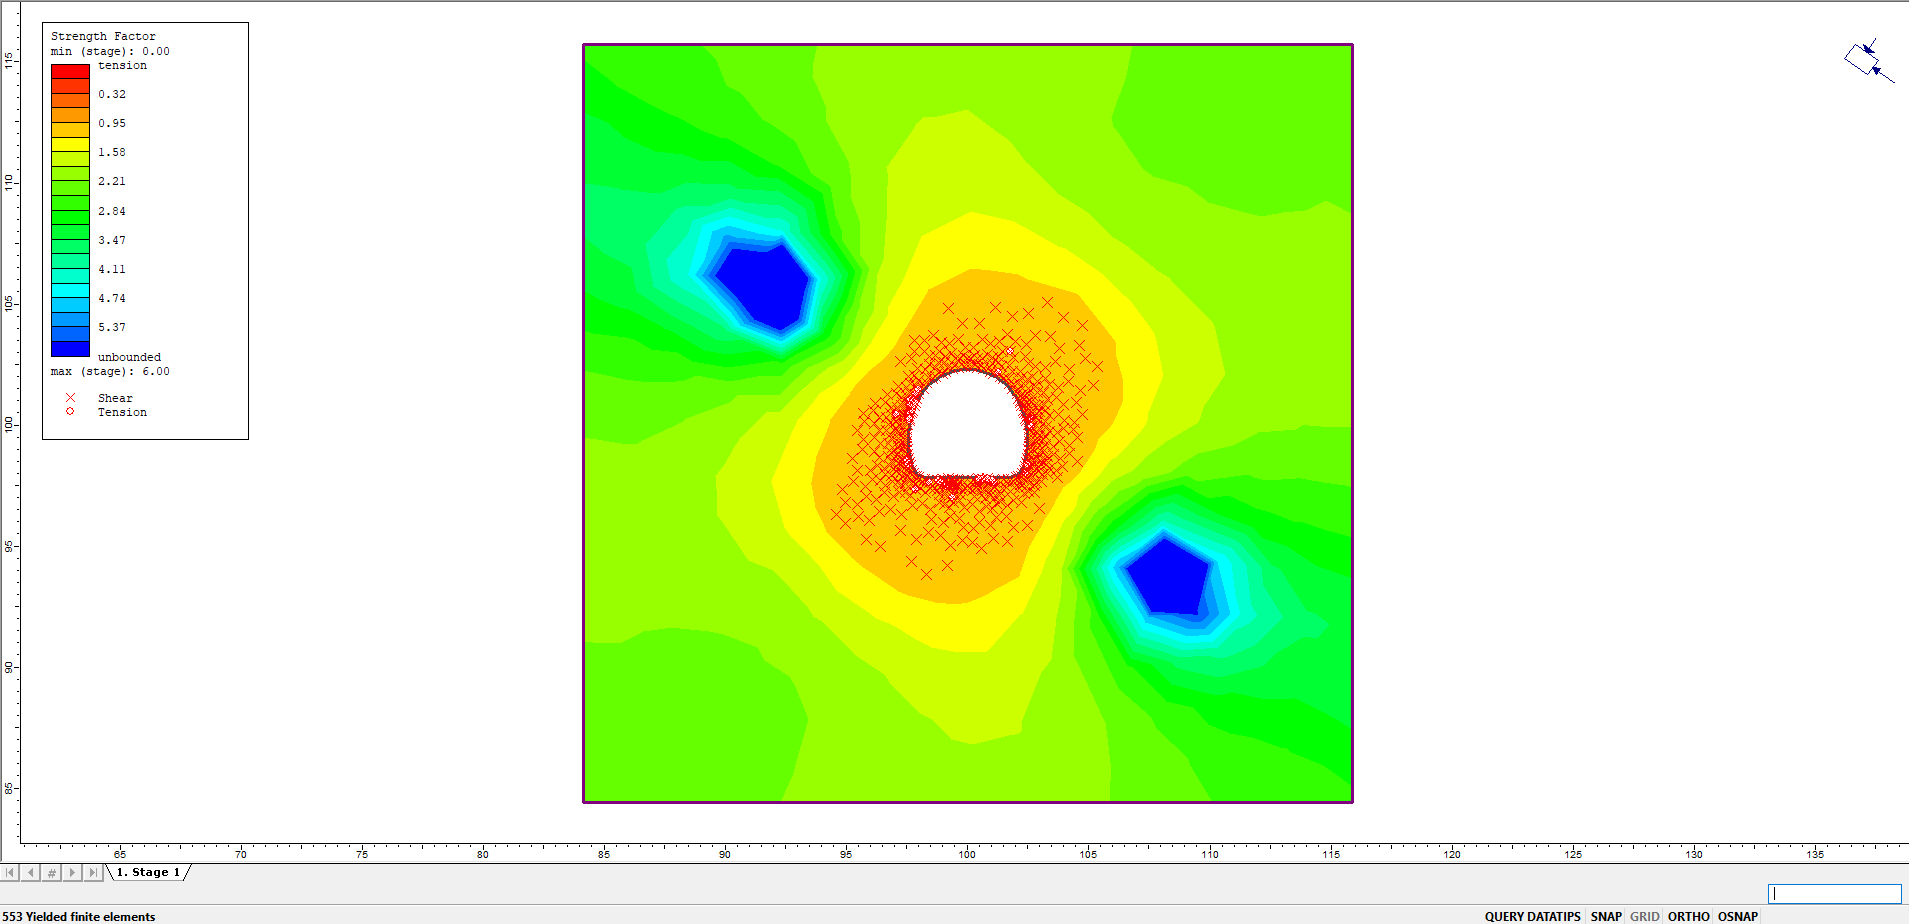
The number of yielded elements will be displayed in the status bar (553 yielded finite elements).
Observe the zone of plastic yielding (X = shear failure, O = tensile failure) around the excavation (zoom in as necessary). Notice that the yielded zone roughly corresponds with the zone of strength factor < 1 from the elastic analysis, with additional propagation beyond this limit, as expected from a plastic analysis.
- Toggle the display of yielded elements off.
- Let's look at plastic displacements. Select Total Displacement from the drop-down menu in the toolbar.
Note the maximum displacement indicated in the status bar.
This is nearly three times the maximum displacement from the elastic analysis. From the displacement contours, the overall maximum displacement is occurring in the floor of the tunnel.

Toggle the deformation vectors on:
- Select: View > Display Options
- In the Display Options dialog, toggle Deformation Vectors ON
- Enter a Scale Factor of 5
- Select Done.
- Click Zoom Excavation
 in the toolbar

The first step in the “Support Tutorial” (model without support) is now complete.
4.0 Compute Part 2: Plastic Analysis with Support
- Select: File > Recent Folders > Tutorial Folder and open the Adding Support Part 2 file from the Support folder.
In this model, a radial array of 5m long pattern bolts were installed on a 1x1 meter grid spacing. Bolts were added by selecting Support > Add Bolt. Bolt properties were defined by selecting Properties > Define Bolts. For additional information about adding bolts to a model, visit the Bolts help topic.
- Select: Analysis > Compute


5.0 Results and Discussion Part 2: Plastic Analysis with Support
- Select: Analysis > Interpret

- Let's view the strength factor contours by selecting Strength Factor from the drop-down menu in the toolbar.
- Turn on Yielded Elements
 . The number of yielded elements will be displayed in the status bar.
The yielded zone, based on the extent and location of the yielded elements, is not discernibly different from the unsupported yield zone. However, the number of yielded finite elements decreased from 553 (unsupported) to 518 (bolt support).
Let’s check for yielding in the bolts:
- Click the Yielded Bolts button in the toolbar
 .
. - The yielded bolt elements will be highlighted in red and the number of yielded elements will be displayed in the status bar.
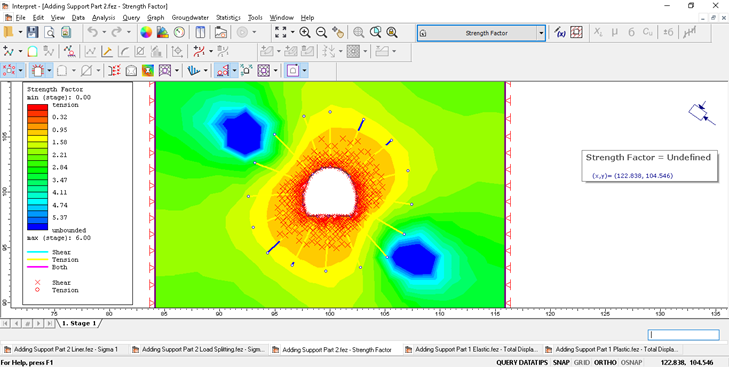
Almost all the bolts have yielded, as shown by the bolt sections highlighted in yellow. This indicates tensile failure of a bolt element. Remember that “bolt elements” for fully bonded bolts are defined by the intersections of bolts with the finite elements.
Almost all the bolts have yielded, as shown by the bolt sections highlighted in yellow. This indicates tensile failure of a bolt element. Remember that “bolt elements” for fully bonded bolts are defined by the intersections of bolts with the finite elements.
Bolt elements can be displayed with the Display Options dialog. This is left as an optional step.
When the bolt properties were defined, a residual bolt capacity equal to the peak bolt capacity was selected. Therefore, even though the bolts have reached their yield capacity, they still provide support.
- Let’s look at the effect of the bolts on the displacement. Select Total Displacement from the drop-down menu in the toolbar.
The maximum displacement is indicated in the status bar.
Compared to the unsupported excavation, the displacements have been slightly reduced. Shotcrete must be added to provide additional support to the tunnel.
5.1 Model (plastic analysis with bolts and shotcrete)
From Interpret, switch back to the Modeller.
5.1.1 Adding a Liner
Let’s line the tunnel with shotcrete.
- Select: View > Zoom > Zoom Excavation

- Select: Support > Add Liner

- When the Add Liner dialog appears, select OK.

- Click and hold the left mouse button and drag a selection window which encloses the entire excavation. Release the left mouse button. Notice that all excavation line segments are selected.
- Right-click the mouse and select Done Selection or press the Enter key. The entire tunnel will now be lined, as indicated by the thick blue line segments around the excavation boundary.
Whenever the model requires multiple adjacent boundary segments to be lined, it is always best to use a selection window to ensure all desired segments are selected.
5.1.2 Liner Properties
Now define the liner properties. The properties will correspond to a 200 mm thick layer of steel fibre reinforced shotcrete.
- Select: Properties > Define Liners


- Set Name = Shotcrete, Young’s Modulus = 3000 MPa, Poisson’s Ratio = 0.25, and select Material Type = Plastic.
Since the liner properties were entered with the first liner type selected, it is not necessary to assign these properties to the liner as they are automatically assigned to the liner elements. - Let’s re-run the analysis. Save
 this as a new file called Adding Support Part 2 Liner.fez. (Make sure to select Save As and not Save, or the program will overwrite the previous file).
 - Compute
 the new file.
5.2 Interpret (plastic analysis with bolts and shotcrete liner)
- From the Modeller, switch back to Interpret.
- Now let’s see how the addition of the shotcrete liner affected the strength factor and yielding. Select Strength Factor from the drop-down menu in the toolbar.
The extent of the region encompassed by the contour of strength factor = 2 is now considerably reduced. Let’s do a direct comparison of the three files on the same screen. - Ensure that Adding Support Part 1 Plastic.fez, Adding Support Part 2.fez and Adding Support Part 2 Liner.fez files are open.
- Now tile the three views using the Tile Vertically
 button in the toolbar.
 - Display the Strength Factor in each view.
- Select Zoom Excavation
 in each view (F6).
 - Select Zoom Out approximately 5 or 6 times, in each view (F4).
- Display the Yielded Elements
 in each view.
 - If the legends are displayed, toggle them off (right-click on a Legend and select Hide Legend). The screen should appear as below.
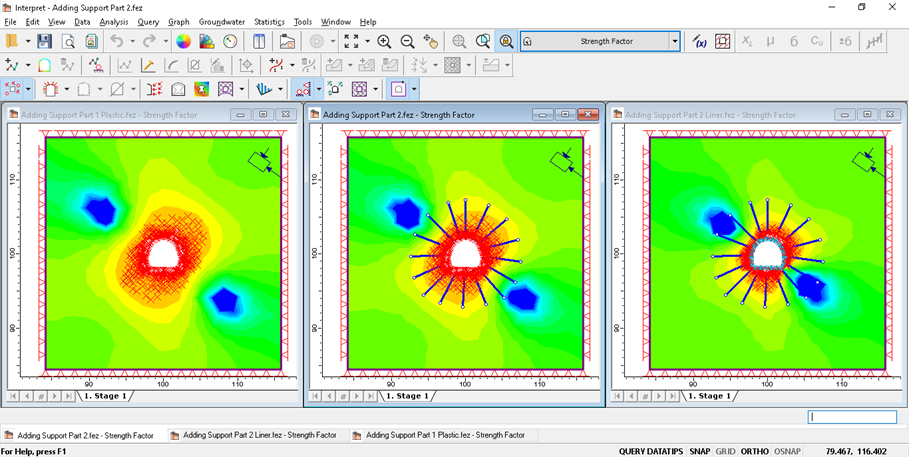
Observe the effect of support on the strength factor contours and the yielded element zone. It is apparent that pattern bolting alone has minimal effect, whereas the application of a shotcrete liner in conjunction with the pattern bolting has been effective in reducing failure around the tunnel.
- Maximize the view of the file supported with bolts and liner file.
- Toggle the display of Yielded Elements
 off .
off .
Let’s check for yielding in the bolts.
- Click Yielded Bolts
 in the toolbar.
Again, most of the bolts have yielded, as shown by the bolt sections highlighted in yellow. The status bar indicates the total number of yielded bolt elements.
The number of yielded bolt elements was decreased by the presence of the liner.
- Toggle off the display of yielded bolt elements.
Let's look at yielding in the liner in the same manner as yielding in the bolts.
- Click Yielded Liners
 in the toolbar.
The status bar will indicate the number of yielded liner elements.
- Select: View > Zoom > Zoom Excavation

The yielded liner elements, highlighted in red, are concentrated at the upper right, lower left, and floor of the tunnel. Let’s closely examine the stresses near the yielded liner elements. Select Sigma 1 from the drop-down menu in the toolbar. There are high stress concentrations at the bottom left of the tunnel which yielded some liner elements. This has caused the model to not achieve convergence within the set max number of iterations on the last load step as shown in the engine log file (Analysis > Log file). Since the model did converge for the cases without liner support, the overall rock and bolt results can be compared between the three cases of no support, bolt support only and bolt and liner support as non-convergence is only due to the yielding of the new liner elements. Additionally, the model could achieve convergence for all but the very last load step. Non-convergence indicates that the liner is incapable of sustaining the entire change in stress assuming the support is installed immediately after tunnel excavation where no displacement takes place prior to the installation of support. However, a certain amount of deformation will always occur before the support can be installed. Later in this tutorial, we will use the Load Split option to model the installation of support after some deformation has occurred in the tunnel. Toggle the yielded liner elements off by re-selecting the Yielded Liners button in the toolbar. Toggle the legend off (right-click on a Legend and select Hide Legend).
- Finally, let’s look at the displacements after adding the liner. Select Total Displacement from the drop-down menu in the toolbar.
The maximum total displacement is indicated in the status bar.
The combination of bolts and shotcrete has reduced the maximum displacement to about half of the unsupported value.
- Select: View > Display Options
- In the Display Options dialog, toggle Deformation Vectors on.
- Enter a scale factor of 10 and select Done.
As can be seen from the contours and the displacement vectors, the maximum displacement is still occurring in the floor of the tunnel. This suggests the casting of a thicker concrete slab on the tunnel floor, however we will not be exploring this further in this tutorial. An optional exercise is to experiment with changing the thickness of the liner on the floor of the tunnel (to, for example, 300 mm).
It is left as an optional exercise to display the Total Displacement contours and Deformation Vectors for the Adding Support Part 1 Plastic.fez, Adding Support Part 2.fez and Adding Support Part 2 Liner.fez files, to obtain the figure below.
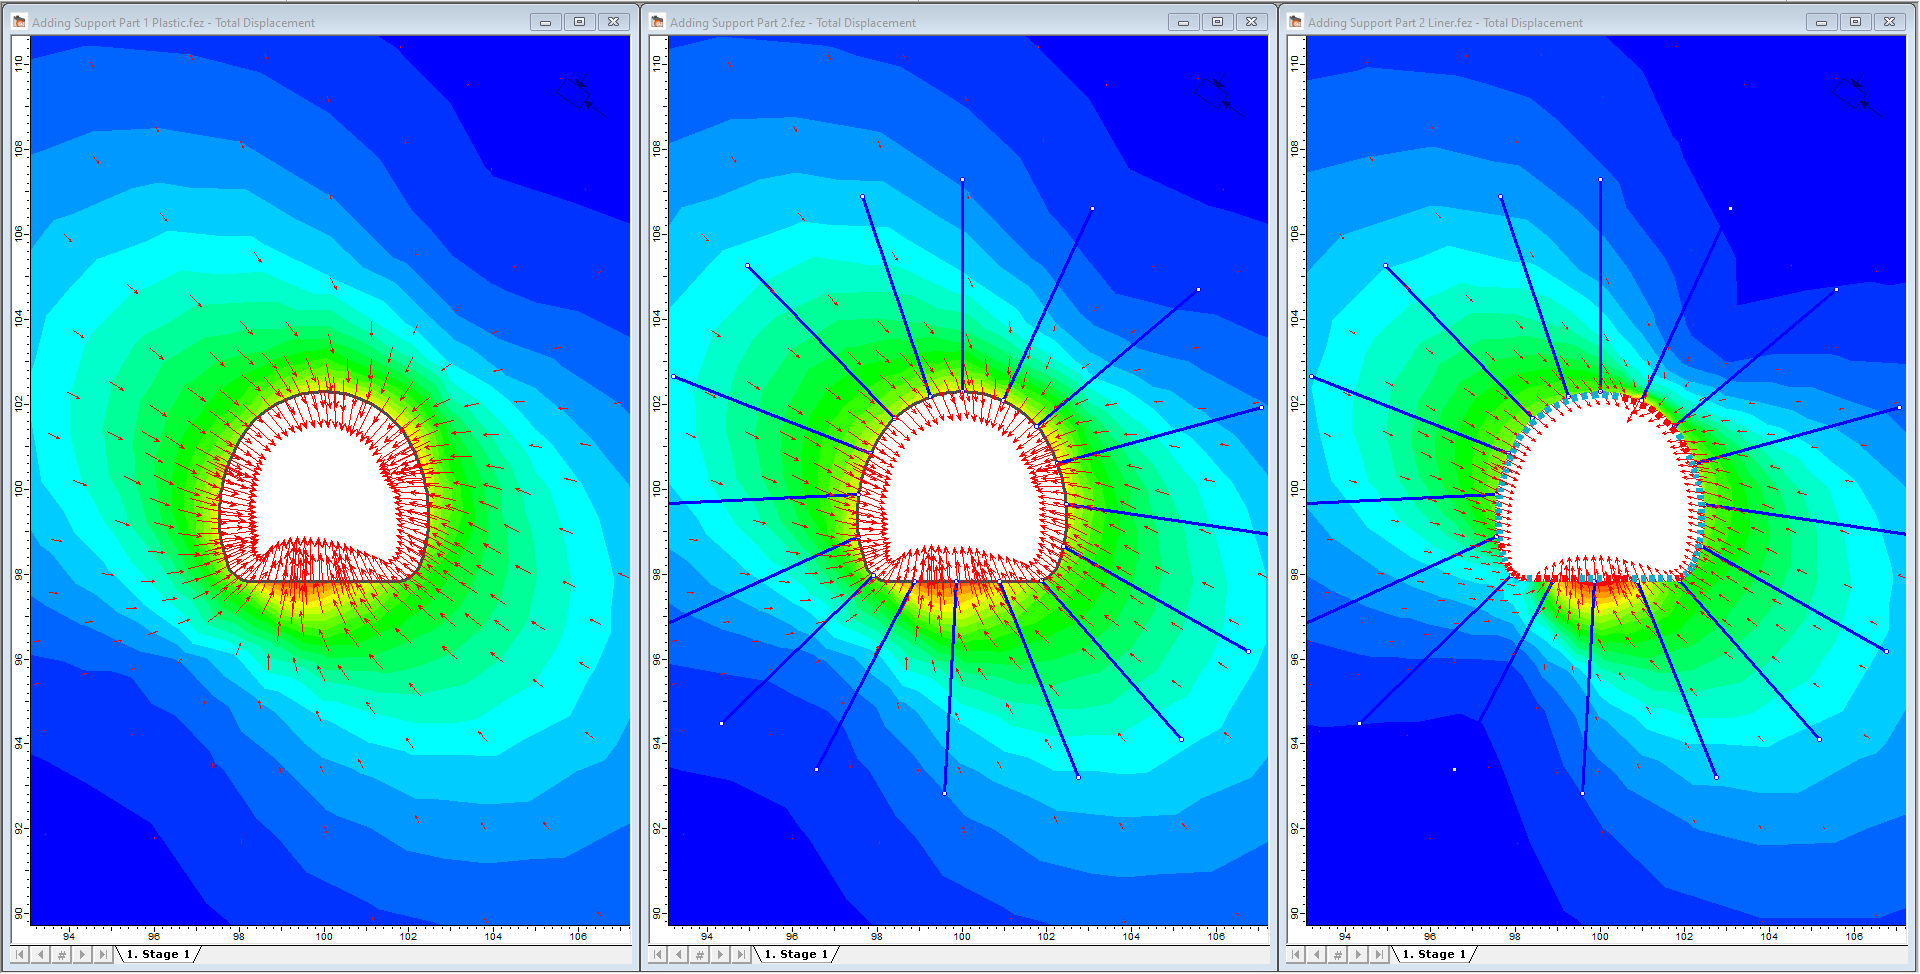
Hints:
- Tile and zoom the views as described earlier for the strength factor contours.
- When displaying the deformation vectors for each view, use a Scale Factor of 5 (in the Display Options dialog).
5.2.1 Show Values
The Show Values option allows the user to display analysis results for bolts, liners, and joints either graphically or numerically, directly on the model.
- Maximize the view of the Adding Support Part 2 Liner.fez file. Press F6 to Zoom Excavation.
- Right-click on the liner and select Show Values > Show Values Options


- Check the Liners check box and select Axial Force.
- Under Display, check Bars and uncheck Lines.
- Set the Size of largest value (of all stages) = 25 mm
- Click OK.
Graphical “bars” representing the axial force in each liner element should now be displayed directly on the model, as shown in the figure below. The Min and Max values of Axial Force are also displayed.
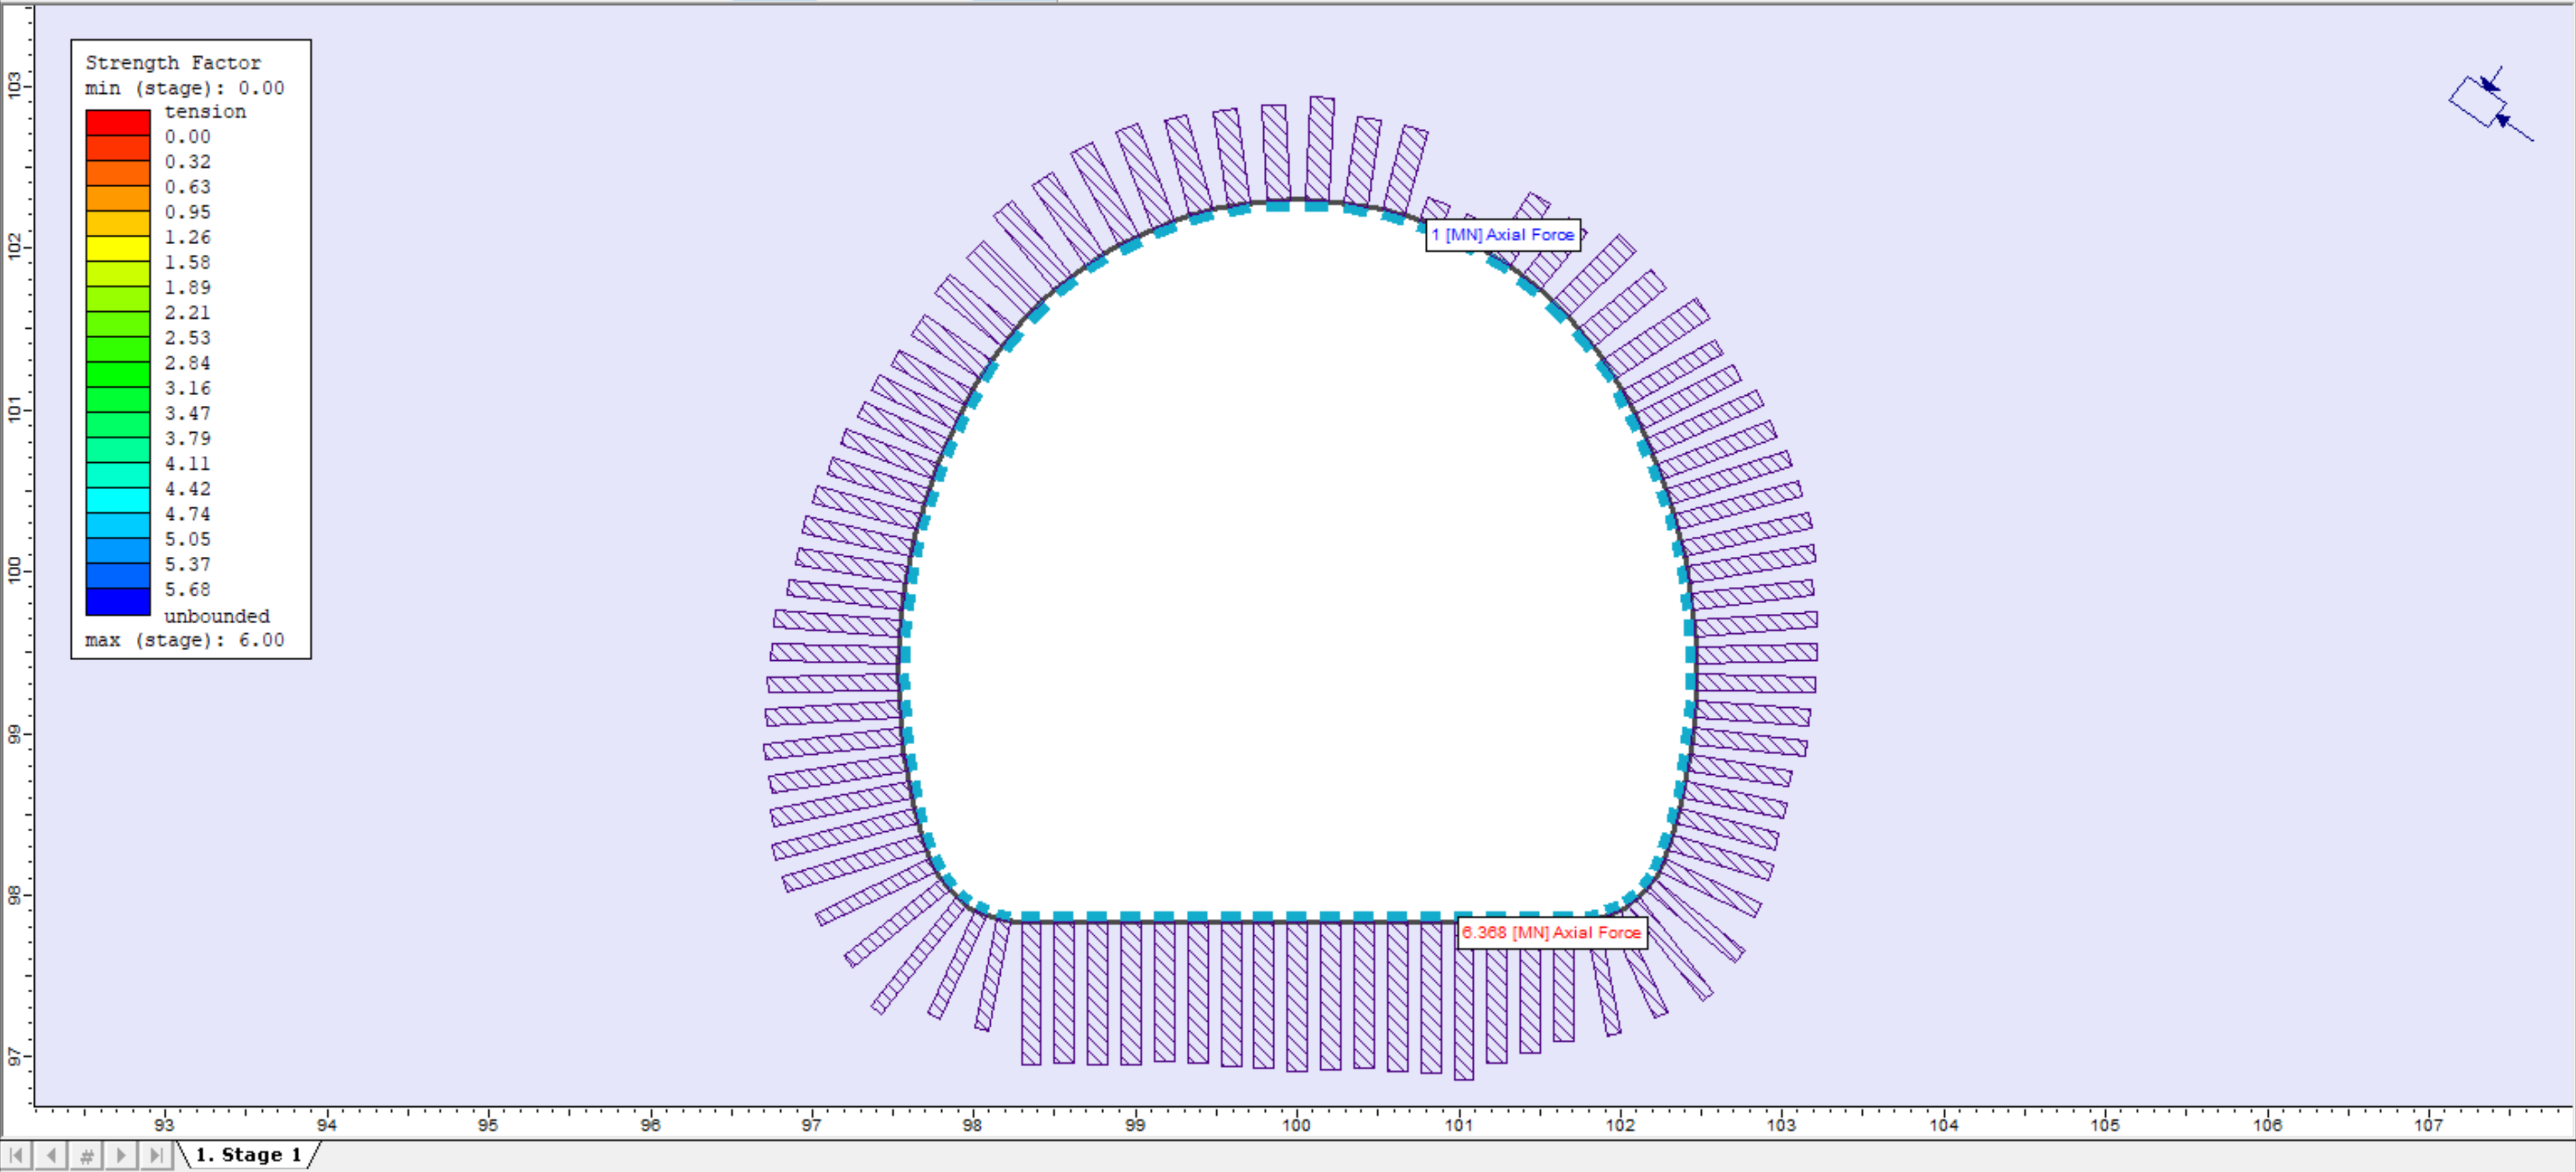
The following additional steps were used to obtain the figure above:
- In Contour Options, set the Contour Mode to Off.
- In Display Options, turn off Excavation Boundaries and Bolts.
5.3 Model (plastic analysis with bolts and shotcrete, in conjunction with load splitting):
Ensure that the Adding Support Part 2 Liner file view is selected, before switching back to the Modeller.
5.3.1 Load Splitting
The previous analyses in this tutorial (i.e. pattern bolt support only and combined pattern bolt/shotcrete support) assumed that the support was installed immediately after excavation and that no displacement takes place prior to the installation of support.
However, this is not realistic; a certain amount of deformation will always occur before the support can be installed. The Load Split option in RS2 allows the user to “split” the field stress induced load, between any stages of the model, rather than applying the entire field stress load in the first stage. Load splitting can therefore be used to simulate the delayed installation of support. In this simple example, it will be done as follows:
- A staged model is required to enable Load Splitting. Set Number of Stages = 2 in Project Settings.
- Using the Load Splitting option, the Load Split will be defined as 30% in Stage 1 and 70% in Stage 2.
- The support (bolts and liner) will then be installed in Stage 2, rather than Stage 1.
Effectively, this allows some deformation to take place in Stage 1 (before support is installed), and then the support installed in Stage 2 can respond to the remainder of the field stress induced load.
The first step towards including load splitting in a model is to set the Number of Stages in Project Settings.
- Select: Analysis > Project Settings


- Go to the Stages tab and set Number of Stages = 2. Click OK.
Now enter the Load Split information: - Select: Loading > Load Split

- Select the Enable Load Split check box
- Enter Split Factor = 0.3 for Stage 1 and Split Factor = 0.7 for Stage 2.
- Click OK.
The 0.3 / 0.7 load split assumes that 30 % of the field stress induced load has been relieved by displacement of the excavation boundaries before the support is installed. These load split factors can be estimated from a plot such as shown in the RS2 Axisymmetric Analysis Tutorial, based on how close the support can be installed to the advancing face of the tunnel.
5.3.2 Installing the Support
Select the Materials and Staging workflow tab.
- Select: Properties > Assign Properties

To install the support at Stage 2: - Make sure the Stage 2 tab is selected (at the bottom left of the view).
- In the Assign dialog, select Bolts from the list at the top of the dialog, and then select the Install button.
- Press F2 to Zoom All.
- Use the mouse to click and drag a selection window enclosing all the bolts in the model.
- The bolts should now be selected. Right-click the mouse and select Done Selection, or press Enter. The bolts are now installed in Stage 2.
- Now select Liners from the list in the Assign dialog and select the Install button.
- Press F6 to Zoom Excavation.
- Use the mouse to click and drag a window enclosing the entire excavation. All the liner elements on the excavation boundary should now be selected.
- Right-click the mouse and select Done Selection, or press Enter. The entire liner is now installed in Stage 2.
- Close the Assign dialog by selecting the X in the dialog or press Esc twice (once to exit the Install mode, and once to close the dialog).
Now verify the staging of the support. Select the Stage 1 tab. The bolts and liner should appear in a light blue colour, indicating that they are NOT INSTALLED in Stage 1. Select the Stage 2 tab. The bolts and liner should appear in the dark blue colour, indicating that they are installed in Stage 2.
5.4 Compute
Before analyzing the model, let’s save this as a new file called Adding Support Part 2 Load Splitting.fez. (Make sure to select Save As and not Save, or the program overwrite the Adding Support Part 2 Liner.fez file).
- Compute
 the model.
5.5 Interpret (plastic analysis with bolts and shotcrete, in conjunction with load splitting)
- Select: Analysis > Interpret

- Select Stage 2 tab to view the effect of load splitting on the results of the analysis. Select Strength Factor from the drop-down menu in the toolbar.
- Click Yielded Elements
 in the toolbar.
There are now more yielded finite elements than before the load split.
Strength factor contours and yielded zone are essentially the same as prior to the load split; this is anticipated, as the load split was not expected to have a significant effect on the strength factor.
- Toggle the display of Yielded elements off.
- Click Yielded Bolts
 in the toolbar.
The status bar now indicates the number of yielded bolt elements.
The number of yielded bolt elements is substantially reduced because of the load split, from 194 before the load split, to 157. This is the primary result of interest from the load splitting analysis.
Similarly, check the yielding in the liner:
- Click Yielded Liner
 in the toolbar.
The number of yielded liner elements is significantly less when compared to before the load split. The load split has nearly eliminated yielding in the liner. Additionally, the model now achieves convergence within the set max number of iterations due to less yielded liner elements.
- Toggle the display of yielded bolts and liners off.
- Select Total Displacement from the drop-down menu in the toolbar to view displacements.
The maximum displacement is shown in the status bar.
The displacement contours and deformation vectors are essentially the same as prior to the load split.
In summary, it should be emphasized that the primary effect of the load splitting in this example was to decrease yielding in the liner and the bolts, thus improving the modeling of support. By allowing some unsupported deformation to take place in the first stage, we have traded off some increased yield of the rock mass, for decreased yield in the support.
- Select the Stage 1 tab and view Total Displacements.
The maximum displacement is shown in the status bar.
Compare this with the maximum displacement after the final (second) stage. Based on these numbers only, the proportion of the displacement taking place in the first stage is approximately 30%. This is in good agreement with the load split of 30 / 70. Better agreement than this should not be expected as the analysis is plastic and there is only one number for comparison. This concept further illustrates the significance of using the load split option in RS2.
5.6 Alternative methods to Load Splitting
For the simulation of 3-dimensional effects in tunnel support design, other methods are available in RS2 which are more accurate than the load split method. These involve material softening and core replacement, and are discussed in the 3D Tunnel Simulation and Tunnel Lining Design Tutorials.
The material softening/core replacement approach is the recommended method of simulating 3-dimensional tunneling effects with RS2 and has superseded the load split method.
5.7 Bolts
Thus far, the nature of the bolts installed has not been discussed. However, based on the modulus of 200,000 MPa, it can be assumed that solid steel dowels were used.
- Let’s change the bolt modulus to 75,000 MPa, as the estimated stiffness of a seven-strand steel cable.
- Re-run the analysis, keeping all other model parameters the same as in the load split example.
The strength factor and displacement results are nearly identical when compared to the results using the original 200,000 MPa bolts. The major difference is that bolt yielding has been greatly reduced:
Bolt Modulus | Maximum Displacement | Number of Yielded Bolt Elements |
200,000 Mpa | 0.060 m | 157 |
75,000 Mpa | 0.060 m | 70 |
This suggests that solid steel dowels may be too stiff for this very weak and highly stressed rock mass. The high stiffness of the reinforcement is not compatible with the large plastic strains which occur near the excavation boundary and which result in overstressing of the dowel/grout bond. The less stiff cables provide an almost identical support load (in terms of the extent to which the plastic zone is restricted and the deformations are limited) to the grouted dowels, but the cable/grout bond is not overstressed to nearly the same extent as for the dowels.
This concludes the Adding Support Tutorial.