Materials and Staging
1.0 Introduction
This tutorial will demonstrate the use of multiple materials and staging in RS2, using material and stage boundaries. The model represents a longhole stope in an orebody that has different properties than the surrounding rock mass.
The model consists of four stages. The slope is excavated in the first three stages and backfilled in the fourth stage. Support (cables) are installed from the access drifts to the hanging wall.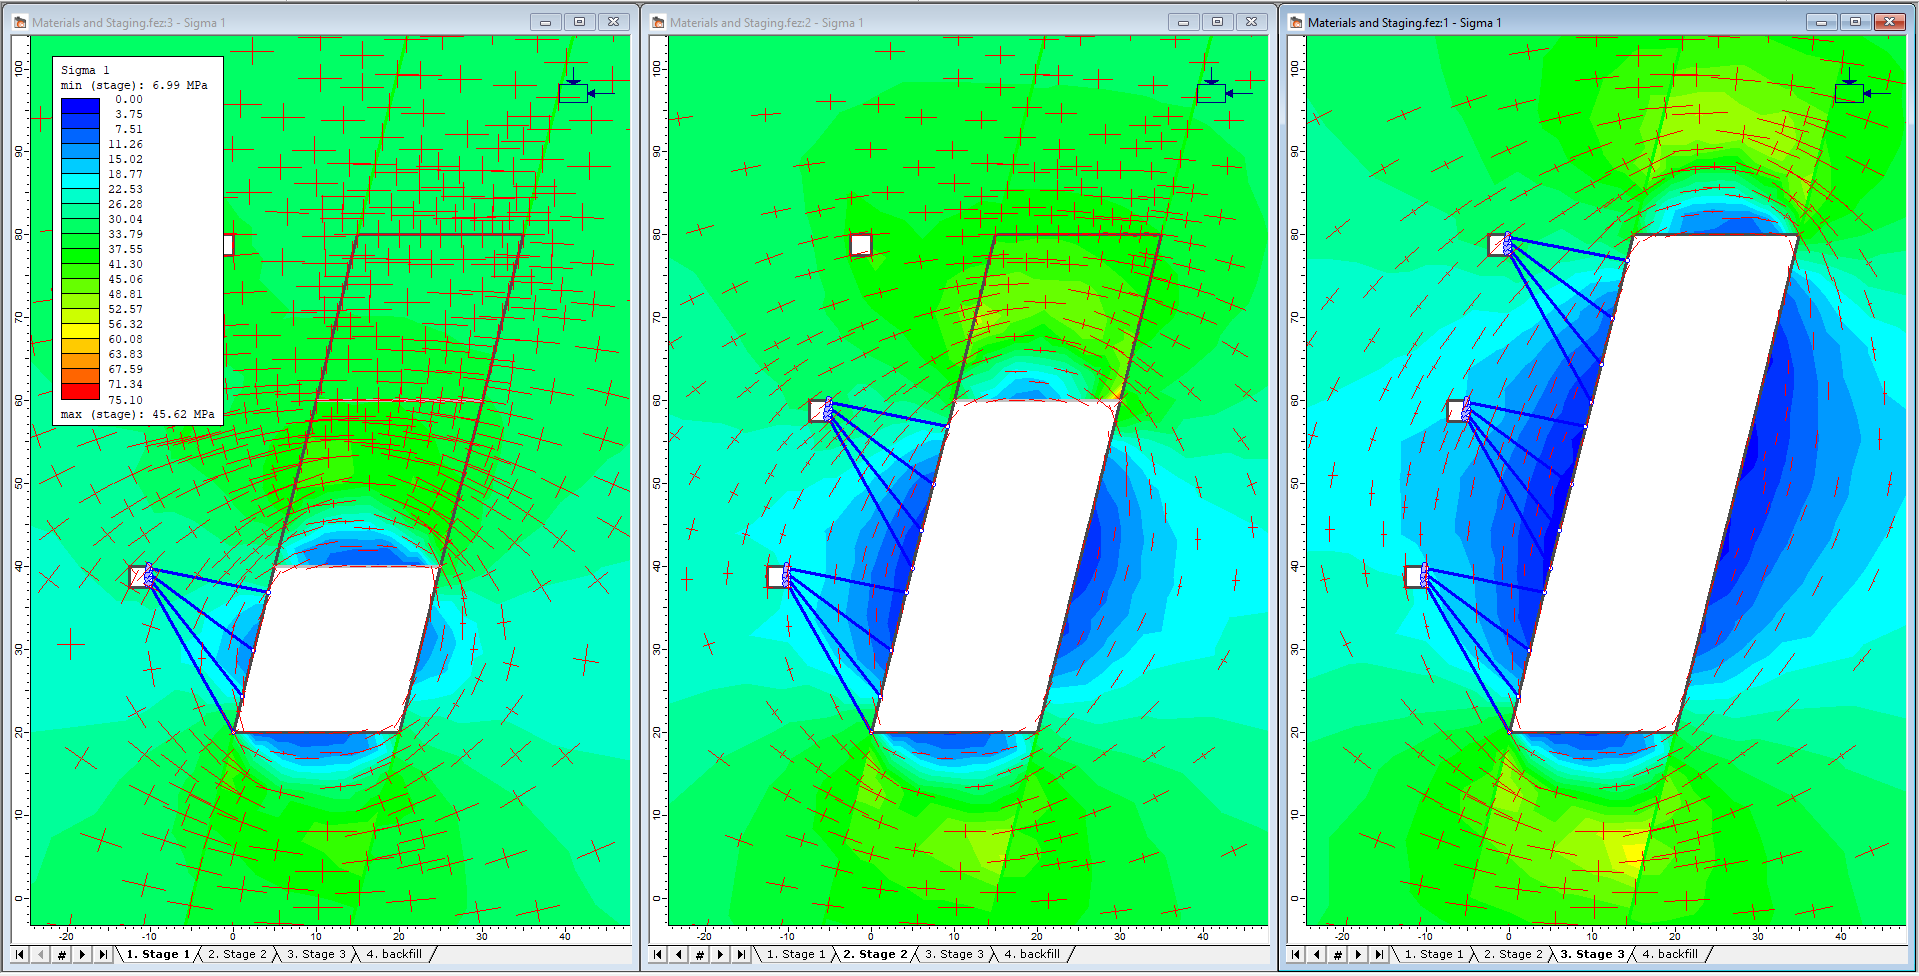
The model is already created. This tutorial focuses on the analysis of results using RS2 Interpret. The model should appear as shown below: 
2.0 Compute
- Select: File > Recent Folders > Tutorial Folder > Underground Mining. Open the Materials and Staging Tutorial file.
- Select: Analysis > Compute

3.0 Results and Discussion
- Select: Analysis > Interpret

By default, a multi-stage model will open to Stage 1. Selecting the desired stage tab in the lower-left corner allows the user to view results for different stages of the model.
3.1 Sigma 1
Let’s zoom in.
- Select: View > Zoom > Zoom Excavation

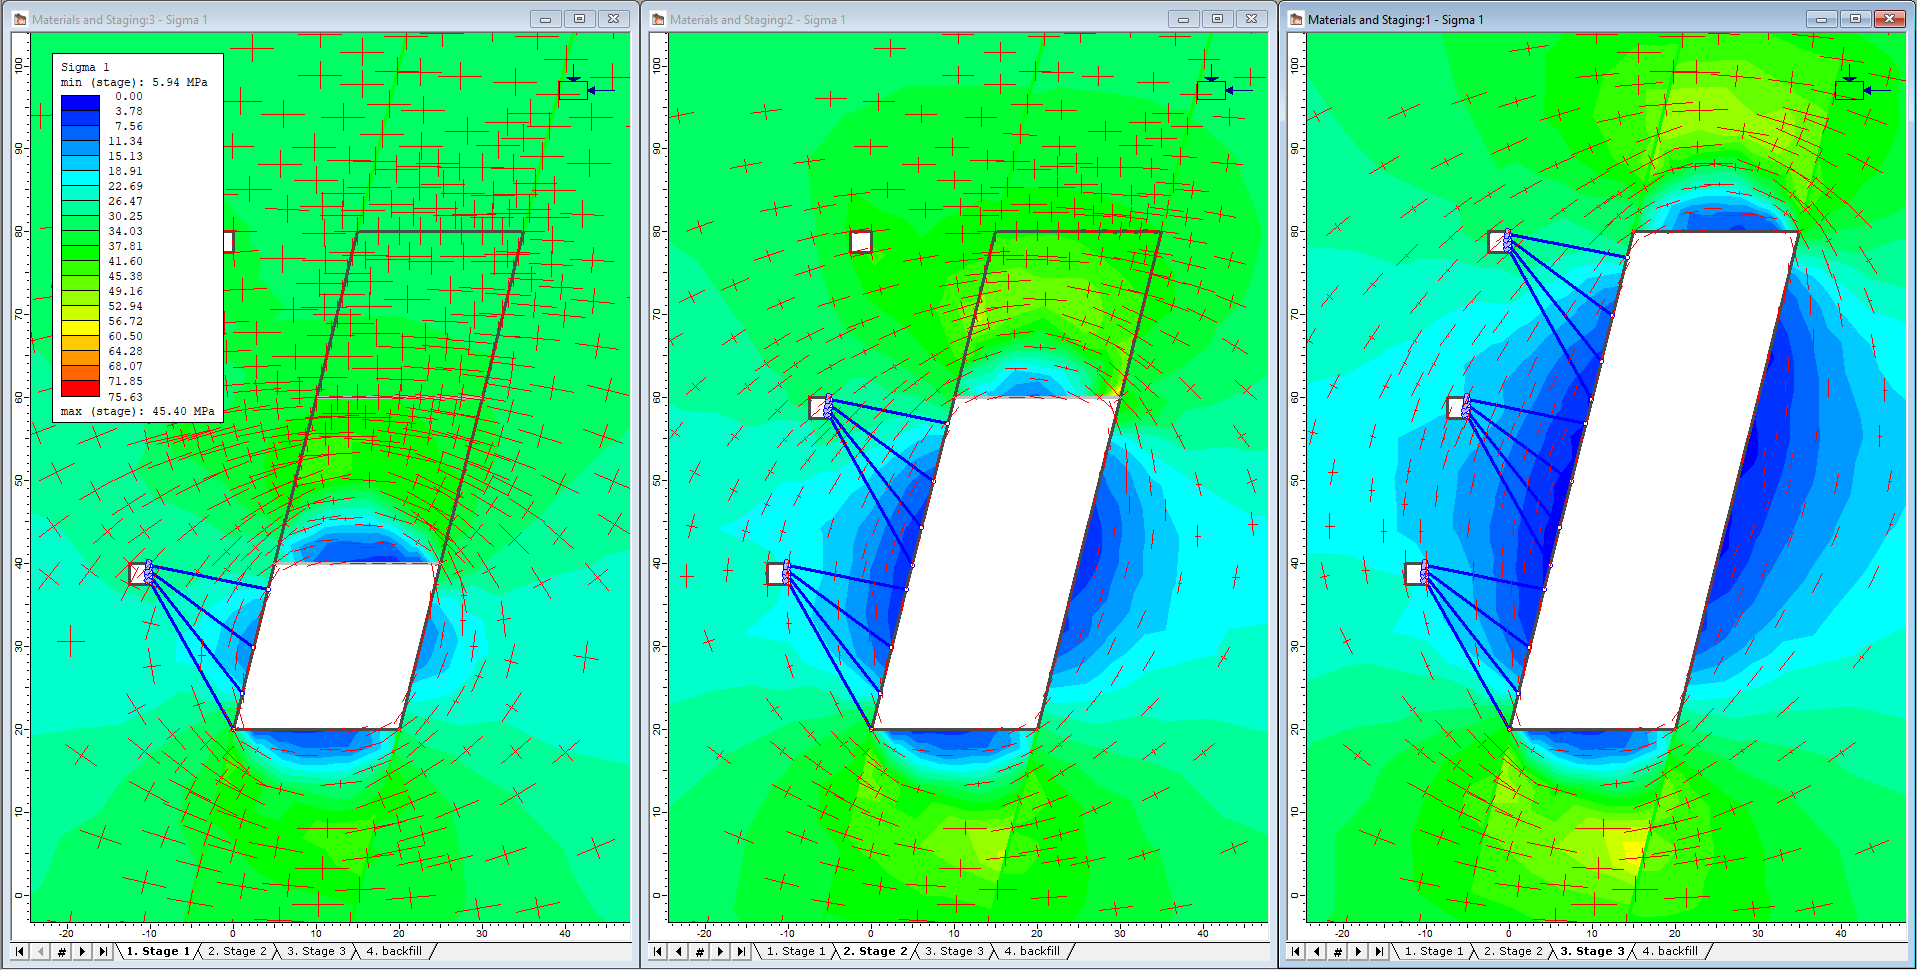
- The Sigma 1 Stage 1 results are now displayed. Select the Stage 2, 3 and 4 tabs and observe the changing stress distribution.
- Use Page Up / Page Down keys to change the viewing stage.
- Select Display Stress Trajectories
 in the toolbar.
 - Again, select the different stage tabs and observe the stress flow around the excavation.
It is also possible to compare results at different stages on the same screen:
- Select Window > New Window (twice) to create two new views of the model.
- Select the Tile Vertically
 button in the toolbar
 - Select: View > Zoom > Zoom Excavation

- Select the Stage 1 tab in the left view, the Stage 2 tab in the middle view, and the Stage 3 tab in the right view.
- Display the stress trajectories in each view.
- Hide the legend in the right and middle views (View > Legend Options).
- Right-click in any view and select Contour Options. Click in each view and select Auto-Range (all stages) to ensure that the same contour range is used for all stages.
Close the contour options dialog. The screen should appear as follows:
3.2 Strength Factor
While the three views are displayed, let’s look at the Strength Factor contours:
- Select Strength Factor from the data type drop-down menu in each window.
- Toggle Display Stress Trajectories
 OFF, and Yielded Elements
  ON, using the toolbar buttons in each view.
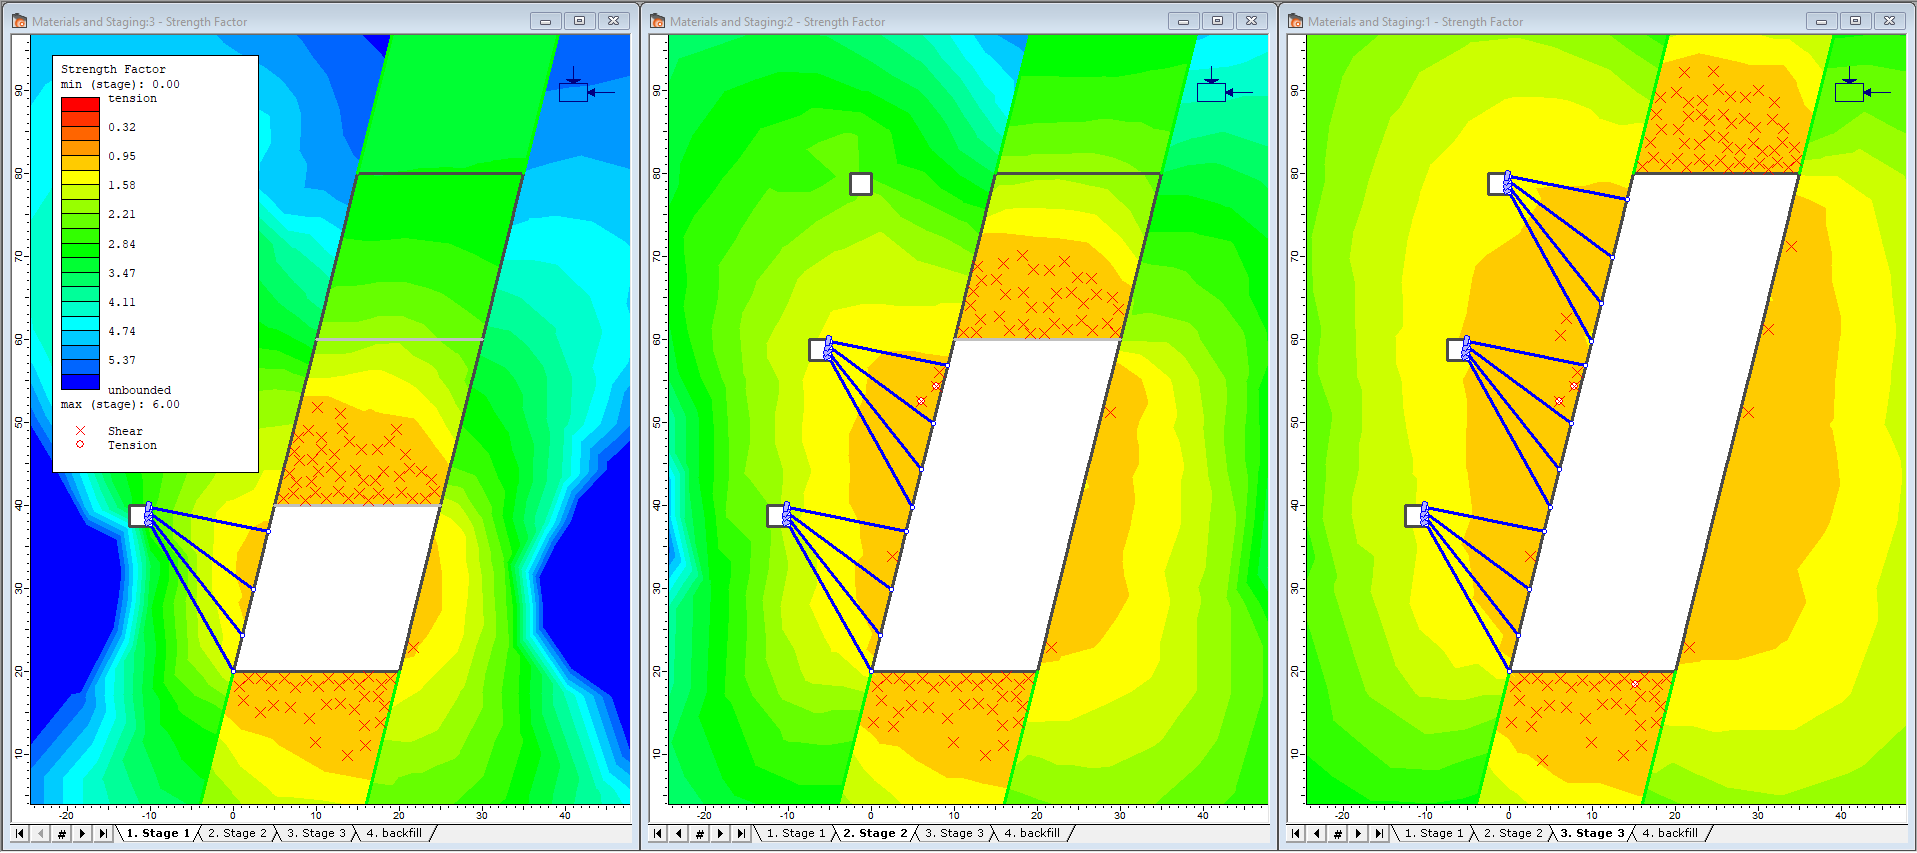
Observe the development of strength factor and yielding around the excavation.
Notes:
- The ore body has different strength factor contours than the surrounding rock mass. This is because the ore body was assigned weaker strength parameters than the rock mass in the model. Differences in material parameters can be viewed in RS2 by turning on Max Data tips and resting the cursor over the different materials in the model.
- Most of the yielding is in the back and floor of the stope (i.e. in the ore body), although there is yielding in the rock mass as well.
Let’s view the model full screen again.
- Maximize any one of the views and re-display the legend if necessary (View > Legend Options)
- Select the Stage 3 tab
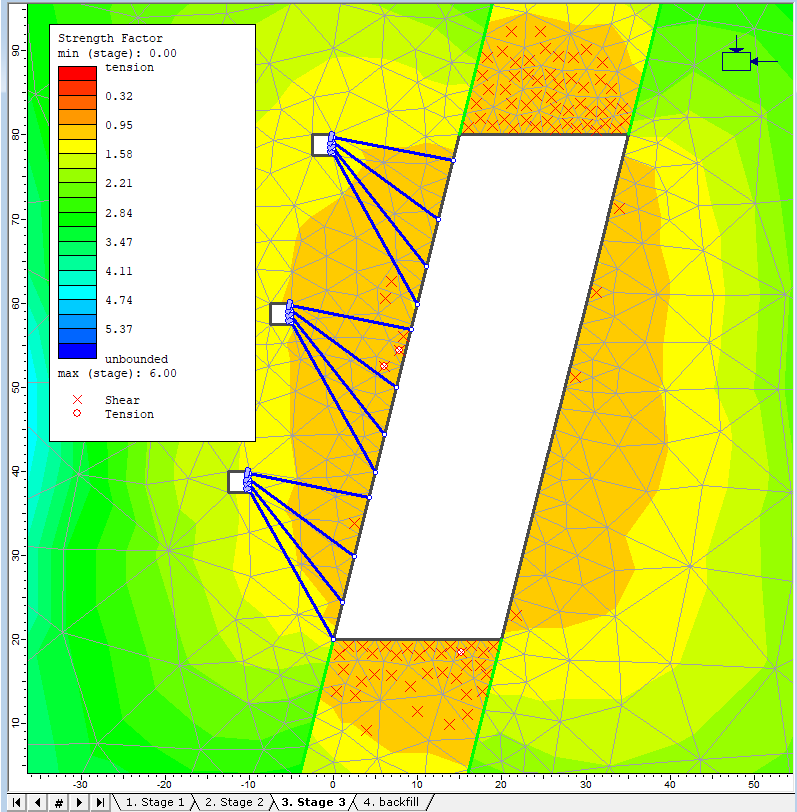
- Select: View > Zoom > Zoom Window to get a closer look at the yielded elements in the stope back. Enter coordinates (0, 100) and (50, 60).
Two symbols are used for the yielded element markers: an "X" marker indicates failure in shear and an "O" marker indicating failure in tension. The symbols are described in the Legend. If tensile failure is accompanied by shear failure, the symbols overlap.
- Display the mesh by selecting Display Options > Stress > Nodes and Elements > Elements.
- Note that for 6-noded triangles, the Yielded Element symbols occur at the mid-side element nodes.
- Use the arrow keys (up / down / left / right), to pan the model around the view. View the contours and yielded elements around the entire excavation.
- Toggle off the Mesh and select Zoom All (F2). Select the Stage tabs 1 to 4 and observe the strength factor contours for each stage.
- Toggle off the Yielded Elements.
3.3 Displacement
- Select: Solid Displacement > Total Displacement from the dropdown menu in the toolbar
- Select the Stage 1 tab. The maximum total displacement for Stage 1 is about 18.5 mm, as indicated in the status bar (0.0185 m)
- Click through the stages and note the maximum displacement at each stage.
- Note that the Stage 3 and Stage 4 maximum displacements are almost identical.
- Select: View > Zoom > Zoom Excavation

- Right-click the mouse and select Display Options.
- Select the Stress tab in the Display Options dialog and toggle on Deform Boundaries
 . Enter a scale factor of 100 and select Done.
 - Click through the stage tabs again and observe the displacement contours with the deformed boundaries displayed.
The deformed boundaries graphically illustrate the inward movement of the excavation boundaries. It is also interesting to observe the shifting of the access drifts towards the hanging wall.

- Close two of the views created in previous steps. Maximize the remaining view and zoom in to the excavation.
- Turn off Deformed Boundaries

3.4 Stage 4
Remember that the fourth stage of the model represents the backfilling of the entire stope with a material that has representative backfill properties. The backfilling of the stope is the only change between Stages 3 and 4 of the model. Practically speaking, the backfill has no effect on the results for this model, compared to the third stage results.
- The purpose of the backfill in this tutorial was to demonstrate how it could be modelled. A practical use of backfill modelling would be a staged model with several excavations that were excavated and then backfilled in sequence. In this case, the stiffness of the backfill would serve to limit displacements in the backfilled excavations. However, that is beyond the scope of this tutorial and is left for the user to demonstrate for themselves.
- The Initial Element Loading for the backfill material was set as Body Force Only. This effectively gave the backfill an active force resisting the excavation deformation, in addition to the passive material stiffness. However, compared to the field stress in this model, this body force is negligible and its effects on the model are minimal. If we were dealing with a surface excavation and gravity field stress, then the body force loading would be more significant. (If we had specified the Initial Element Loading as ‘None’, then only the backfill stiffness would resist deformation.) See the RS2 Help system for more information about Initial Element Loading.
3.5 Bolts
Previous steps in the analysis showed that the bolts had no obvious effect on the stress or strength contours. To gather information about the bolts, the Graph Bolt Data option will be selected. First, select the Stage 3 tab.
- Select: Graph > Graph Bolt Data
 and select the lower set of 4 bolts.
 - When the four bolts are selected (they will appear highlighted by a dotted line when selected), right-click the mouse. Select Graph Selected, and the following dialog will appear:

- Click Plot in the Graph Bolt Data dialog. A graph of Axial Force for the selected bolts will be generated.
- Now repeat the above procedure for the middle and the top sets of four bolts to generate two more graphs. Tile the windows vertically
 .
. - Each graph has a legend that displays bolt and stage numbers. Right-click on the model and Select Display Options. Under the Support tab, turn on Bolt Numbers and close the dialog. The bolt numbers on the model correspond to the numbers on the graphs, allowing the user to identify the bolts.
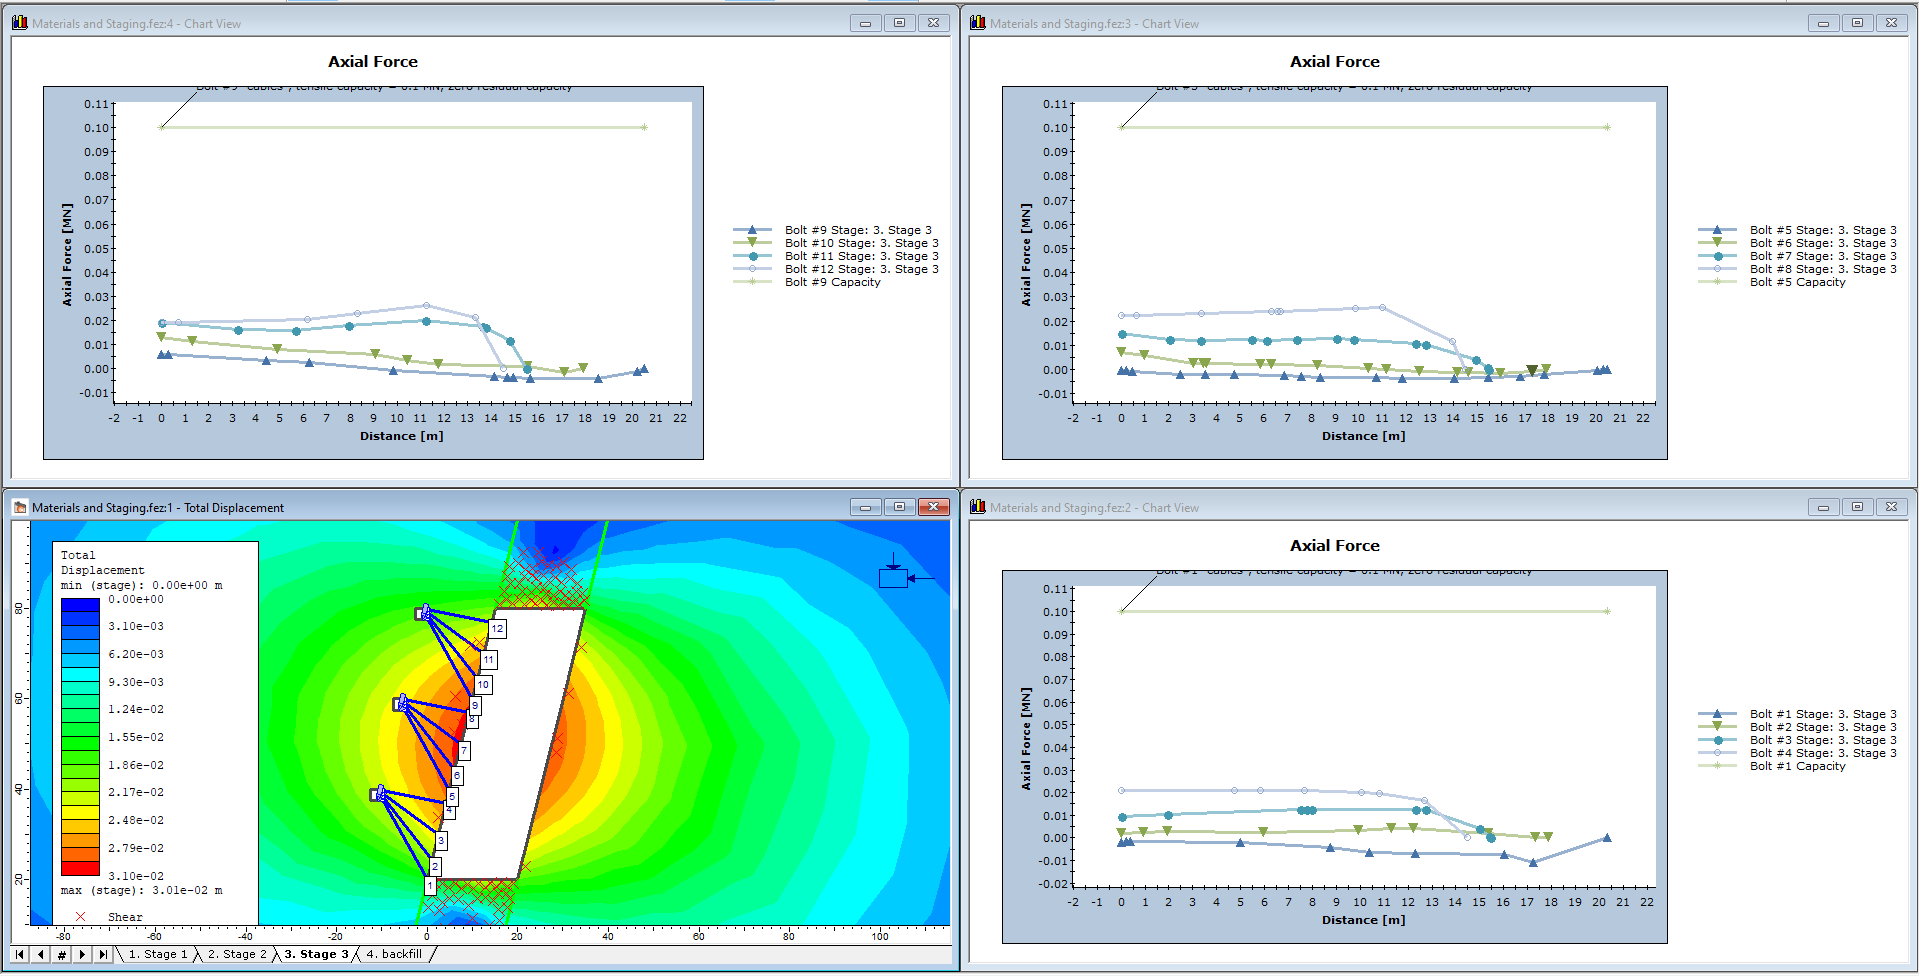
Furthermore, the numbers also identify the end of each bolt and therefore the end of each curve. The start of each curve, therefore, represents the end with the faceplate, at the access drifts. An important point to remember when installing bolts with faceplates between two excavations – the first point of each bolt must be the end with the faceplate. It is important to remember this when creating bolt geometry using the Add Bolt option or DXF import.
Also, notice on the plots that the peak capacity of the bolts (0.1 MN) is indicated by a horizontal line. The force in all bolts is well below this line, indicating that there is no yielding in the bolts.
Let’s verify that there is no yielding in the bolts:
- In the model view, click Yielded Bolts
 in the toolbar
 - The status bar at the bottom of the screen will indicate "no yielded bolt elements"
- As expected, no bolts have yielded (if there were yielded bolts, the yielded sections would be highlighted with a different colour)
Now, let’s plot data from multiple stages on one graph:
- First, maximize the model view
- Select: Graph > Graph Bolt Data
 and select bolt #4
 - Right-click and select Graph Selected as before, except this time select the first three stages to plot, using the checkboxes
- Select Create Plot. Axial Force at stages 1, 2 and 3 for the selected bolt will be plotted
- In this case, the axial force in the bolt, near the faceplate, increases from stage 1 to stage 2, and does not change significantly from stage 2 to stage 3
To summarize the bolt data interpretation, it is always important to look at the effect of the excavation on the bolts, and not just the bolts on the excavation. In many cases, the bolts will have little effect on the contour plots (stress, strength, displacement), but will nonetheless be taking a substantial load. Unless the bolts are installed in a zone of yielding with large displacements (see the RS2 Support Tutorial) this will often be the case.
Examining the load in the bolts allows the design of bolt support by varying bolt parameters (diameter, etc) to obtain optimal stress in the bolt system.
3.6 Differential Results
Previously, this tutorial used a Reference Stage = 0. Differential results between any two stages can be viewed by setting the Reference Stage > 0 in the Stage Settings dialog. For example:
- Select: Data > Stage Settings

- Set the Reference Stage to 1 and select OK.
Notice that the Stage Tabs now display results relative to the reference stage entered. The (r) in the stage tabs indicates that differential results with respect to a reference stage are shown.
See the Differential Data help page for information about how to interpret differential results.
3.7 Log File and Load Step Plot
Let’s examine the Log File (created during an RS2 stress analysis, and the Load Step plot.
- Select: Analysis > Log File
A summary of the number of load steps at each stage, as well as the number of iterations and final tolerance at each load step, is available.
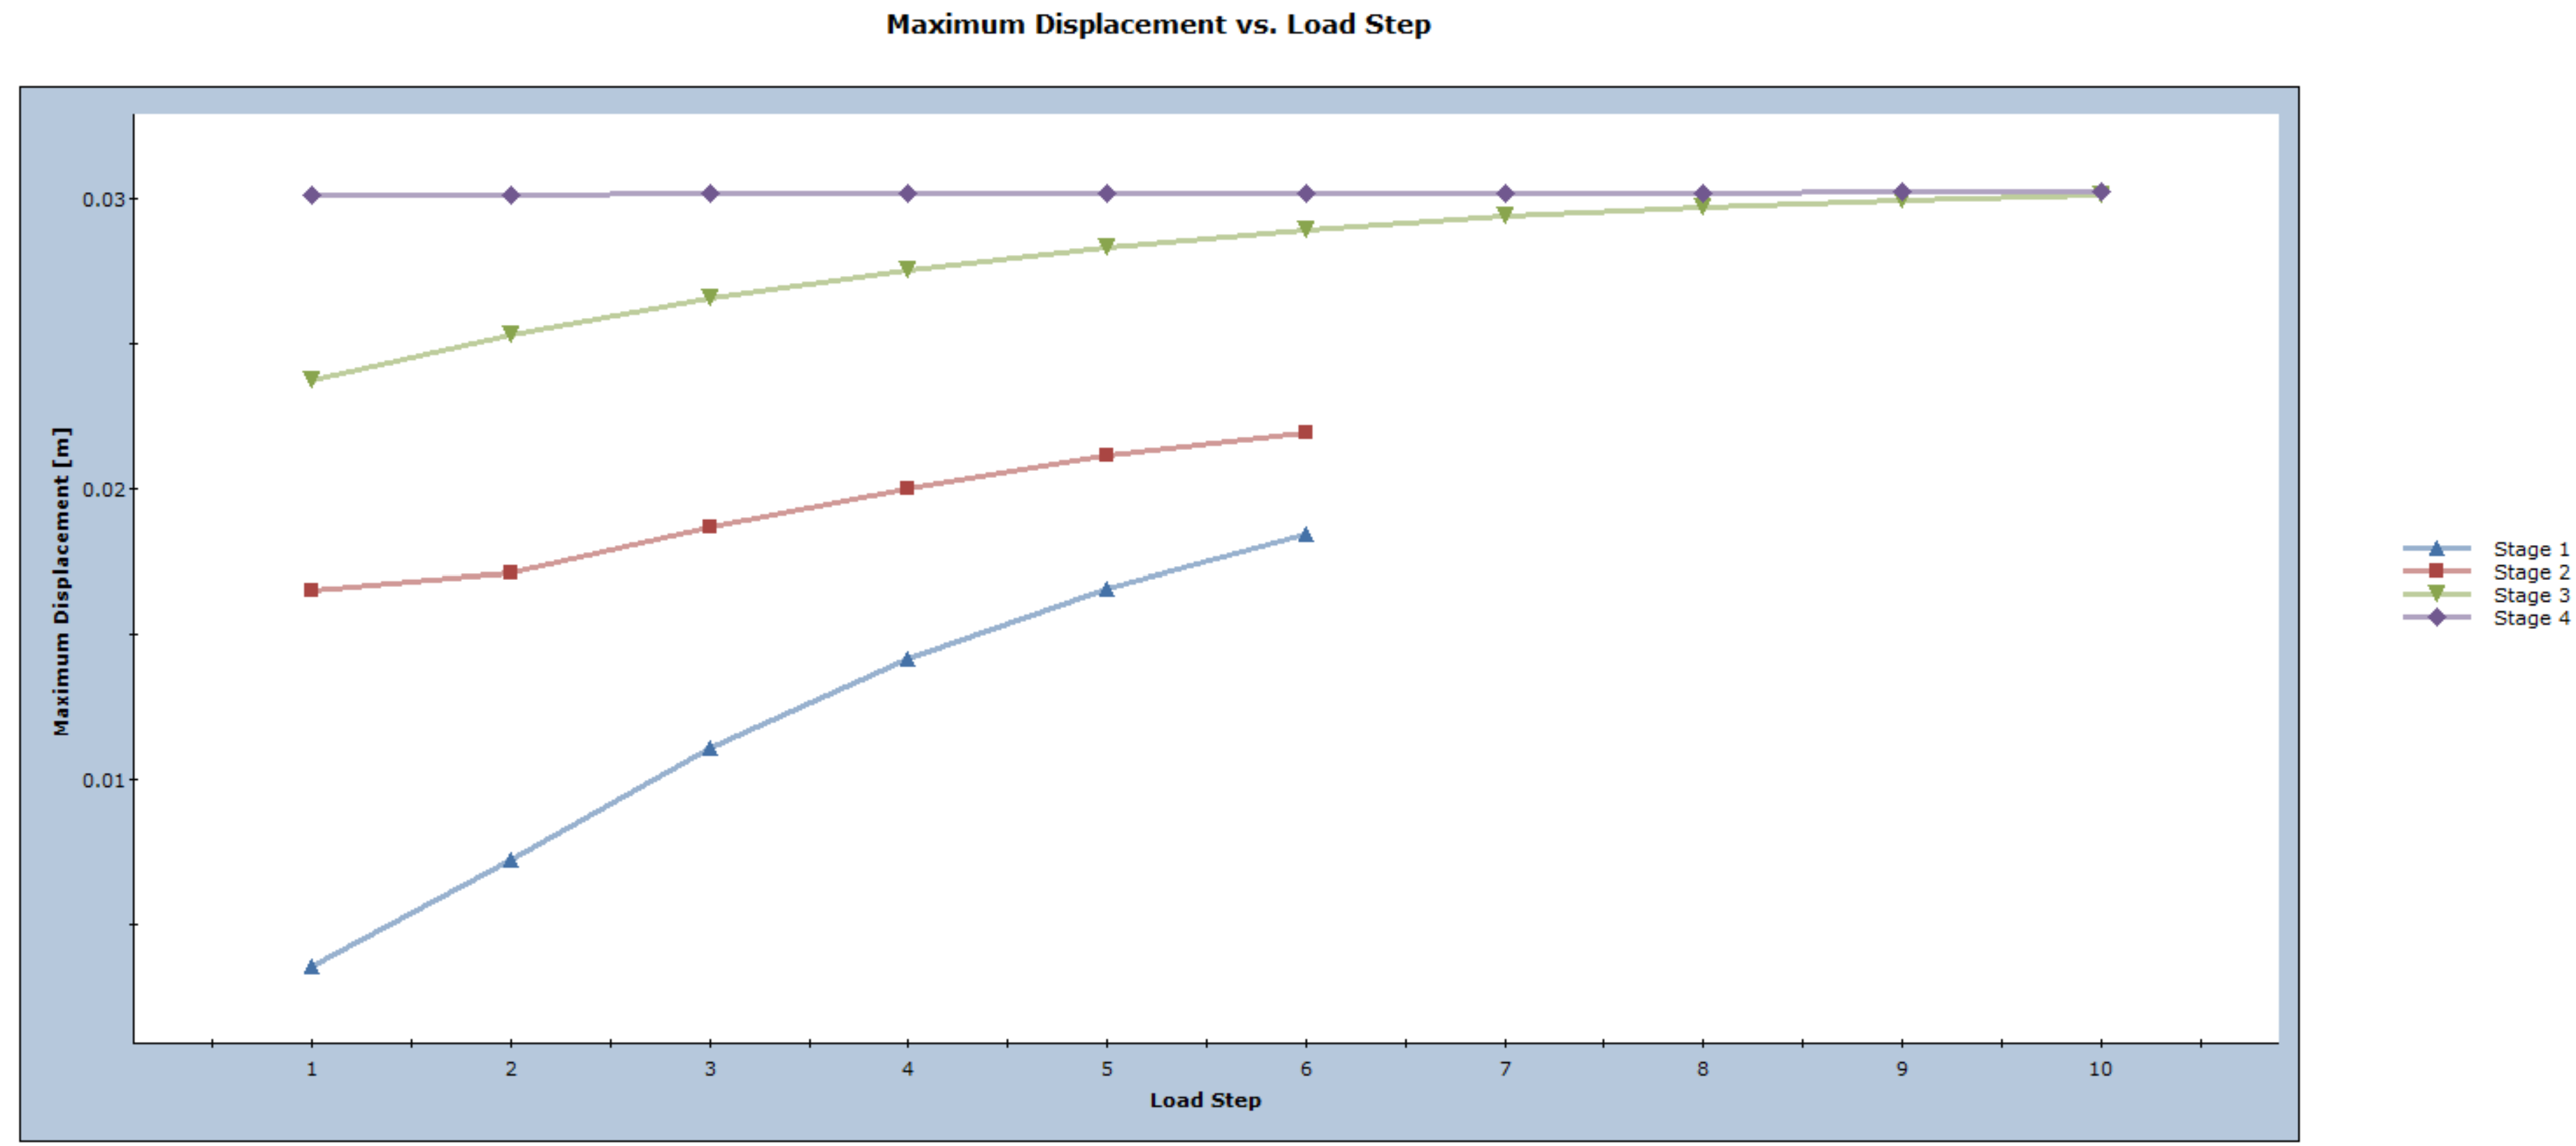
After a plastic analysis, it is a good idea to check the log file to make sure that the solution converged within the specified tolerance. For this example, the final calculated tolerance is less than 0.001 for each load step, indicating convergence within our specified tolerance. The tolerance, number of load steps, and maximum number of iterations can all be user specified in the Project Settings dialog when the model is created.
- Close the log file view.
- Select: Analysis > Load Step Plot
The Load Step Plot plots the maximum displacement at each load step, for each stage.
This concludes the Materials and Staging Tutorial.