Toggle Density Histogram
The Toggle Density Histogram ![]() option on the Legend pane changes the display of contour data bar into a density histogram, as shown below.
option on the Legend pane changes the display of contour data bar into a density histogram, as shown below.
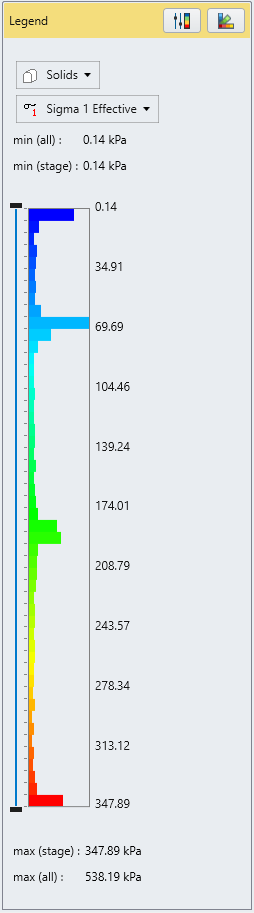
- You can hover the mouse over the plot to view the density (%) for each interval.
- To customize the histogram range, you can drag and move the side bar, and click the Done
 button at the top right corner to apply. Select the Reset
  button can go back to previous histogram range. Select the Toggle Density Histogram
  icon again to switch back to the original contour plot.