Composite Liner Results Overview
The mechanical response of composite liners installed in a model (See more details on how to add liners from Liner Overview) becomes accessible after computing the stress analysis. Once the analysis is complete, liner and interface result entities are generated for each composite liner when navigating to the Results workflow tab. These entities store simulated data for the liner and interface counterparts and allow control over contour plot appearance, along with other composite liner-related functionalities. To avoid the redundancy in contents, this section focuses on the liner result data type since the interface and Joint element results share the same data type. For more information on Interface and joint results, see Joint & Interface Results Overview.
To view result of liner or interface layers of composite liners:
- Compute stress analysis and open Results tab.
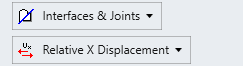
- From the Legend pane on the right-hand side of the viewport, select Liners or Interfaces & Joint for the Result type; and
- Select data type to display from the dropdown menu below.
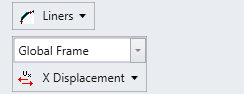
In default, a global frame system is respected to compute/display liner results. In general, the following data types are displayed for liners:
- X Displacement
- Y Displacement
- Z Displacement
- Total Displacement
- Normal Displacement
- Axial Force X
- Axial Force Y
- Axial Force Z
- Shear Force YZ
- Shear Force XZ
- Shear Force XY
- Moment X
- Moment Y
- Moment Z
- Moment YZ
- Moment XZ
- Moment XY
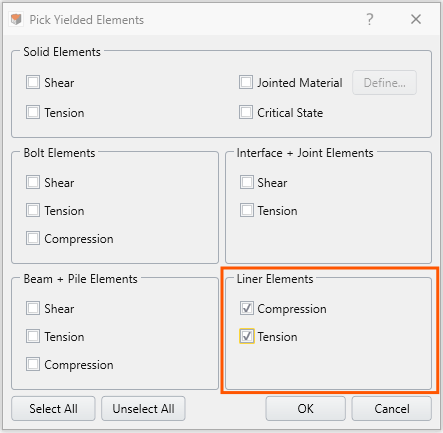
The mode of failure and the failure location can be displayed on liner result entities by selecting the failure mode from Interpret>Yielded Element>Pick Yielded Elements. In RS3, failure of liner elements may occur in two different modes that are compression and tension.
Result Display
For each composite liner entity, result entities form for each group of liner layers and interface layers, where layers of each group are controlled by corresponding result entities. Thus, when a liner result entity is selected, all corresponding layers of liner of corresponding composite liner become selected. Toggling the EYE icon  next to the liner result entity under Visibility pane controls the visibility state of all liners and the visibility of individual liner layer can also be controlled under properties pane.
Properties Pane
The properties pane of liner result entity shows a grid listing all layers (both liners and interfaces) consisting that composite liner. Selecting the liner layer on the grid highlights the boundary of that liner and the visibility can be controlled with EYE icon on that row. Also, the Graph Data functionality depends on the selected layers.
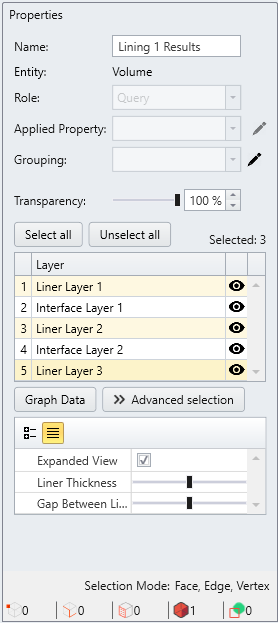
With numerous composite liner applications with various liner and interface properties, installation/removal stage are used in the model, it could become cumbersome process to manually track the liner result that are of interest. In this case, Advanced Liner Selection can be a useful tool, which provides a table of all liners used in the model allowing users to glance through, sort and filter.
Liner Global Coordinate Results
RS3 uses the global coordinate system by default. To view liner global coordinate results, in the Legend pane, ensure Result type = Liners, and Global Frame was selected from the second drop-down list.
Liner Local Coordinate Results
To interpret liner results in local coordinates, a liner local coordinate system (frame) must be defined in the model.
In the Legend pane, ensure Result type = Liners. From the drop-down menu below the Result Type, select a local frame to view liner results in a defined local coordinate system. Note that by default, the local frame name would be Frame or Tunnel Frame.
Select a data type (ex. Axial Force X or Total Displacement) to view different liner results in local coordinate system. Many options are provided to help analyze results, such as defining a liner line query to extract data at critical locations using the Add Liner Line Query, Add Liner Line Query at Intersection, or Add Liner Line Query To Surface options (please refer to the help page Add liner line Query).
See the RS3 Liner Local Coordinate tutorial for an example on analyzing liner results using a local coordinate system.