Graph Liner/Interface Data
Liner and interface results can be plotted on graph using Graph Data function under properties pane. The plotted data respects the selected layers on the grid.
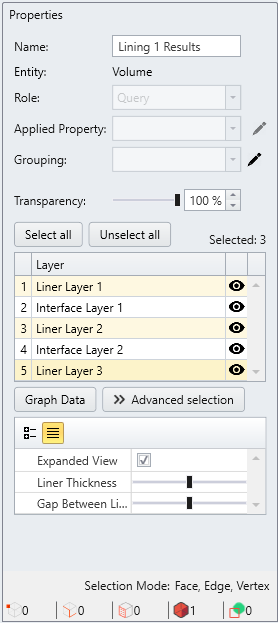
In order to graph data of multiple liner layers from different composite liner on the same chart space, select Interpret > Graph Data while having the liner layers selected from Advanced Liner Selection grid and click Graph Data. See more detailed information in Chart Options.
When both liner and interface layers are selected together on the grid, the result entities for both types will also be selected together. In this case, the Graph Data will create two graphs for liner and interface.
The Legend pane on the right of viewports does not need Result type = Liners or Joints& Interface from the drop-down menu to plot Liner or Interface Results.