Modified Cam Clay Models
1.0 Introduction
In this example we will go over the verification model #13 from RS2. Three types of modified cam clay were tested: normally consolidated, over-consolidated, and highly over-consolidated. The Poisson’s ratio for the three materials are constant.
The experimental/lab simulation results for modified cam clay materials has been recorded in separate spreadsheets.
In this tutorial, we will compare the experimental results and RSData simulation results for each type of modified cam clay.
Finished Product:
The finished product of this tutorial can be found in the Modified Cam Clay Model.rsdata data file. All tutorial files installed with RSData can be accessed by selecting File > Recent Folders > Tutorials Folder from the RSData main menu.
2.0 Creating model
- Open RSData.
- Select the Soil Template for the Project template and click OK.

By default, a soil testing template is shown in the visibility tree, which contains Material Model (Soil), Test Simulation, and Stress Path.

2.1 NORMALLY CONSOLIDATED MODIFIED CAM CLAY MODEL CREATION
Now we will create normally consolidated modified cam clay model.
- In the Visibility tree, click on the
 Trash icon to delete Test Simulations and Lab Stress Paths.
 - Select the Soil Template.
- In the Properties Pane below, change the name to ‘N-Clay-v’.
We will create new ones later.

‘N-Clay-v’ represents normally consolidated clay with constant Poisson’s ratio (υ).
2.1.1 Define Material Properties
We will first create normally consolidated clay model.
First, define properties for normally consolidated modified cam clay with constant Poisson’s ratio. Properties can be found in the “Analytical Solution” tab in Excel spreadsheet: “stress-#013 – drained triaxial test (constant v) – NC Clay.xlsx” as follows:

- Select
 Define Material Models in the toolbar.
 - In the Define Material Properties dialog, select Soil model on the left side.
- Change the name to ‘Modified Cam Clay-v’.
- In the Strength Tab, select Failure Criterion = Modified Cam-Clay.
- Enter the following parameters:
- Critical State Slope = 1.2
- N Parameter = 1.788
- Kappa = 0.0077
- Overconsolidation Ratio = 1
- Lambda = 0.066
- Select the Stiffness tab.
- Enter the following properties:
- Elastic Parameter = Constant Poisson Ratio
- Poisson's Ratio = 0.3
- Click OK to save and close the dialog.
Leave others as default settings. The Strength tab should look as follows:


2.1.2 Define Test Simulations
- Select
 Define Test Simulations in the toolbar.
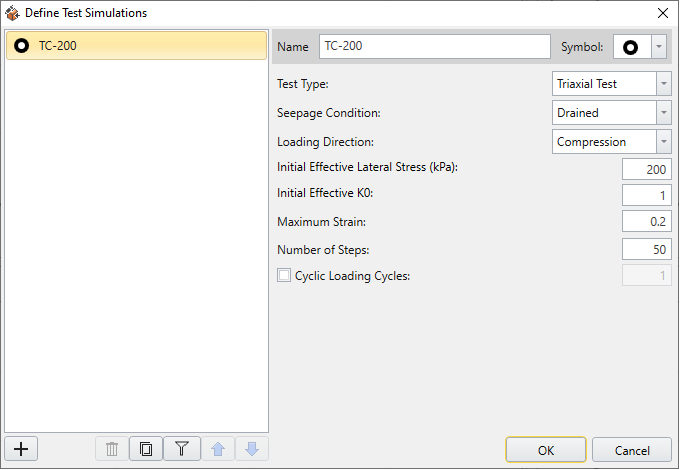
 - In the Define Test Simulations dialog, change the name from Test 1 to “TC-200”, representing triaxial compression at 200 kPa.
- Enter the following parameters:
- Test Type = Triaxial Test
- Initial Effective Lateral Stress (kPa) = 200
- Maximum Strain = 0.2
- Number of Steps = 50
- Leave others as default setting. The dialog should look as follows:
- Click OK to save and close the dialog.
- Select
 Apply Test Simulation in the toolbar.
 - In the Apply Test Simulation dialog, select Material Name = N-Clay-v, and Test Simulations = TC-200.
- Click OK to apply the test simulation and close the dialog.
Now we will apply the defined test simulation to N-Clay-v material.

2.1.3 Define Stress Paths
- Select
 Define Stress Path in the toolbar.
 - In the Define Lab Stress Paths dialog, select Stress Path 1 on the left side.
- Change the name to Analytical-NC, which represents that the stress path is the analytical solution for normally consolidated clay.
- Enter the following parameters:
- Test Type = Triaxial Test
- Seepage condition: Drained
- Loading Direction = Axial
- Initial Effective Lateral Stress = 200
- Initial Effective K0 = 1
- Copy and paste the data from column A through C to the dialog data section.
- Leave other settings in the dialog as default.
- Click OK to save and close the dialog.
- Select
 Apply Stress Path in the toolbar.
 - In the Add Stress Path dialog, select Material Name = N-Clay-v and Stress Path = Analytical-NC. The dialog should look as follows:
- Click OK to apply and close the dialog.
The stress path data can be found in Excel csv file: “stress-#013 – drained triaxial test (constant v) – NC Clay.csv” as follows:

The dialog should look as follows:

Now we will apply the defined stress path to N-Clay-v material.

2.1.4 Results
Make sure Stress Path Graphs tab is selected at the bottom of the program. Now the results for “N-Clay-v” material should display as follows:

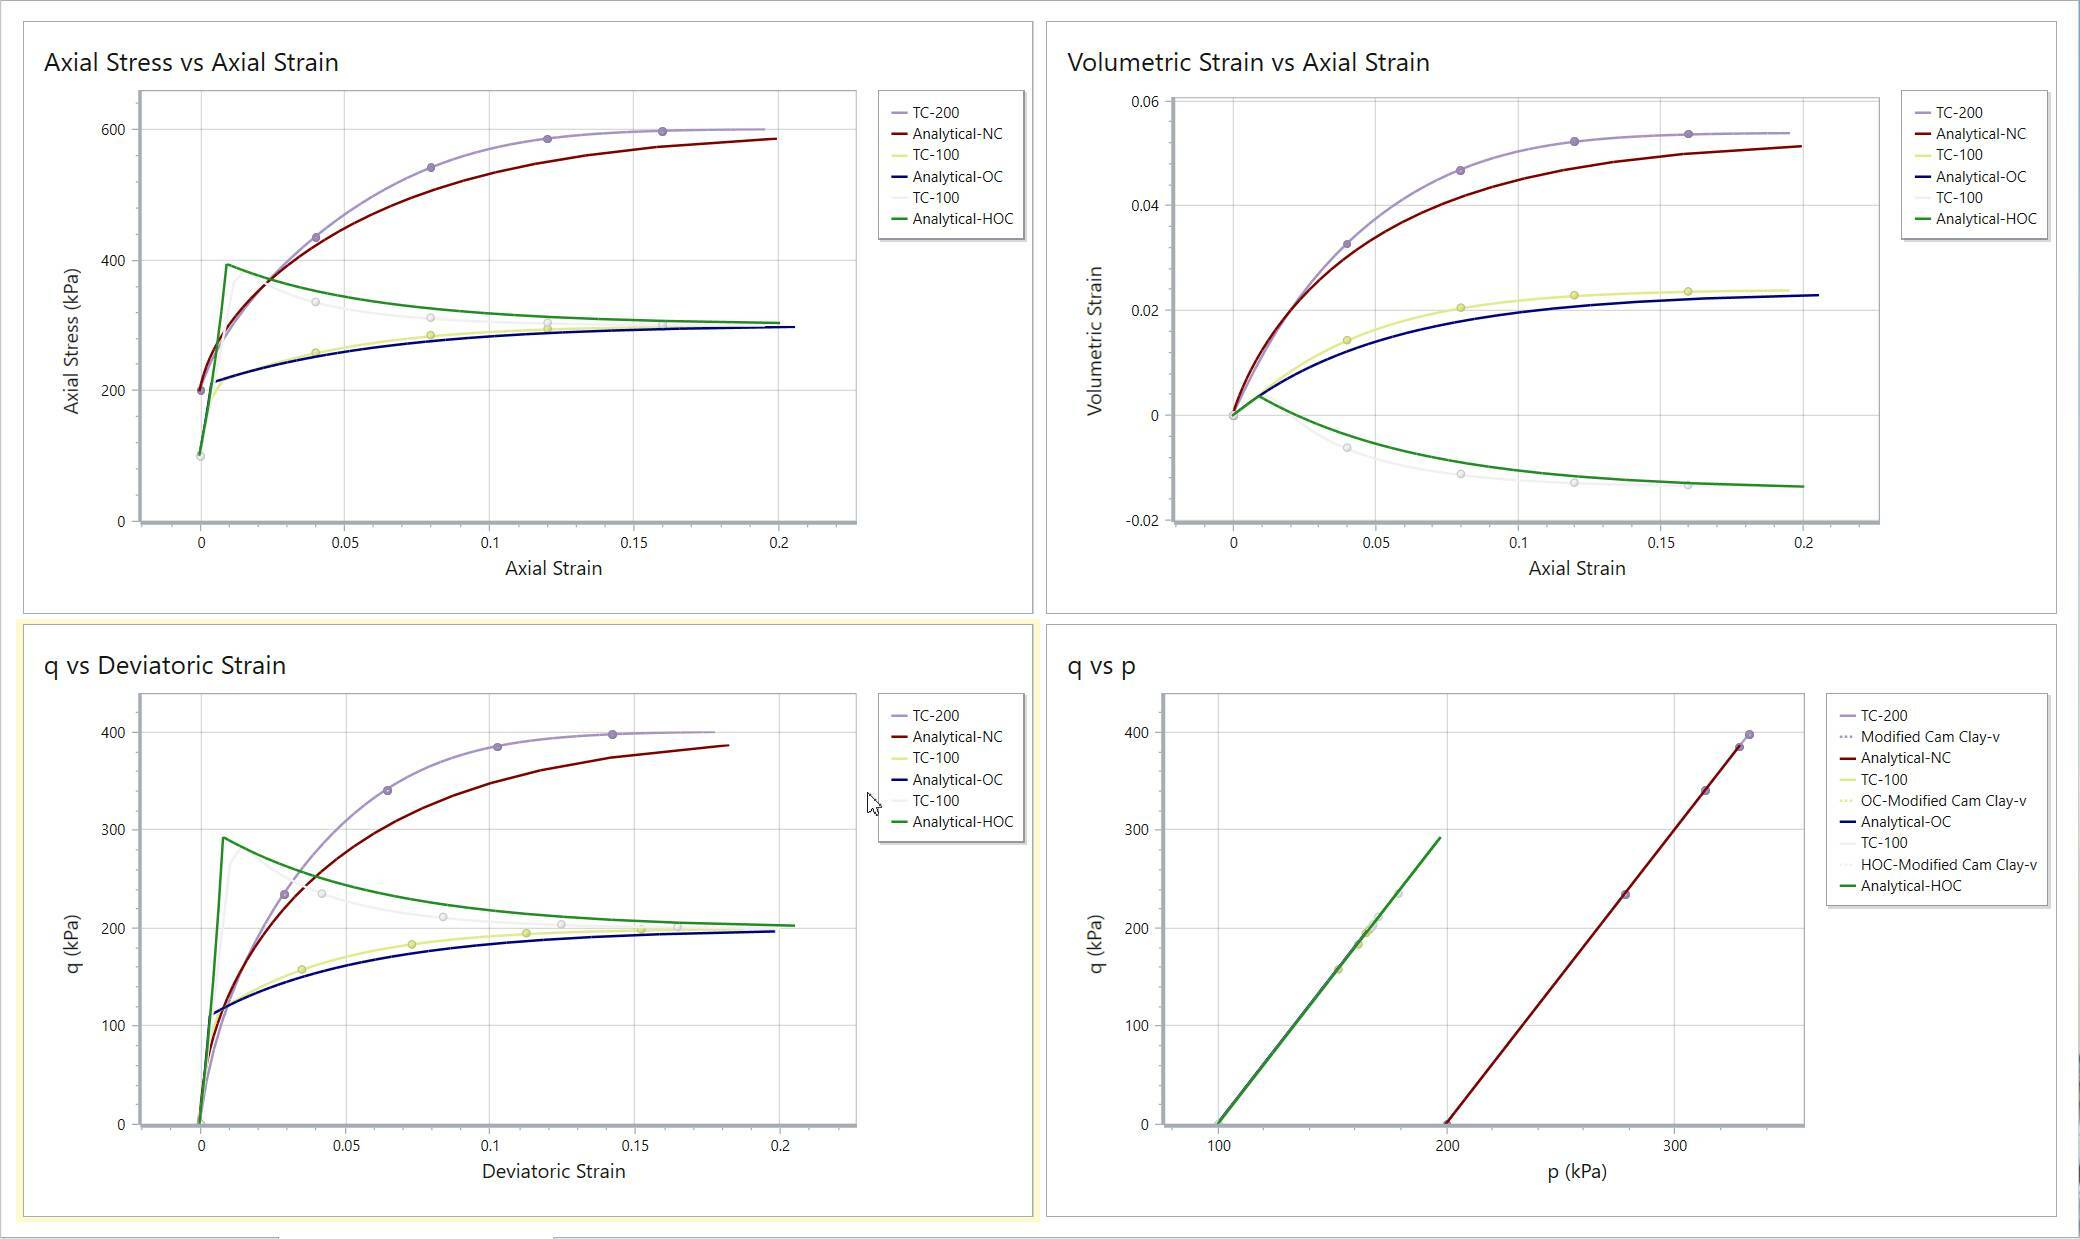
We can see that the purple line (TC-200) matches the red line (Analytical-NC) well. This concludes the normally consolidated clay section. In the next section we will compare over-consolidated clay with highly over-consolidated clay.
2.2 OVER-CONSOLIDATED CLAY AND HIGHLY OVER-CONSOLIDATED CLAY MODELS CREATION
In this section, we will create two more models: over-consolidated modified cam clay model and highly over-consolidated modified cam clay model.
- Click the “Add Material” button twice at the bottom of visibility tree. Two new materials are added.
- Rename material names to “OC-Clay-v” and “HOC-Clay-v”.
- Select
 Define Material Models.
 - In the Define Material Models dialog, press the “Add” button twice at the bottom left to add two new material models as below.
- Select “Material Model 2” and change the name to “OC-Modified Cam Clay-v”, which represents over-consolidated modified cam clay with constant Poisson’s ratio.
- Select “Material Model 3”and change the name to “HOC-Modified Cam Clay-v”, which represents highly over-consolidated modified cam clay with constant Poisson’s ratio.
- Select “Modified Cam Clay-v” and click on the
 Copy Property icon at the bottom left.
 - In the Copy Property dialog, select “OC-Modified Cam Clay-v” and “HOC-Modified Cam Clay-v” as follows:
- Click OK to save and close the dialog.
- Select “OC-Modified Cam Clay-v”. In the Strength tab, enter Overconsolidation Ratio = 2.
- Select “HOC-Modified Cam Clay-v”. In the Strength tab, enter Initial State of Consolidation = Preconsolidation Pressure (Po), and Preconsolidation Stress (kPa) = 500.
- Click OK to save and close the dialog.
- Select
 Apply Material Model.
 - In the Apply Material Model dialog, select Material name = “OC-Clay-v” and assign the corresponding material model “OC-Modified Cam Clay-v”.
- Click OK to save and close the dialog.
- Select
 Apply Material Model again.
 - In the Add Material Model dialog, select Material Name = “HOC-Clay-v” and assign the corresponding material model “HOC-Modified Cam Clay-v”.
“OC-Modified Cam Clay-v” represents over-consolidated modified cam clay with constant Poisson’s ratio. “HOC-Modified Cam Clay-v” represents highly over-consolidated modified cam clay with constant Poisson’s ratio.

For the three material models, only the Initial state of Consolidation and Pre-consolidation Stress (kPa)/ Overconsolidation Ratio are different, other parameters are the same.

Now material properties of “Modified Cam Clay-v” has been copied to “OC-Modified Cam Clay-v” and “HOC-Modified Cam Clay-v”.


Click OK to save and close the dialog.
2.2.1 Define Test Simulations
We next need to define another triaxial compression test at 100kPa.
- Select
 Define Test Simulations.
 - In the Define Test Simulations dialog, add another test by selecting the
 Add icon.
 - Select Test 2 and rename it to “TC-100”.
- Enter the following parameters:
- Test Type = Triaxial Test
- Seepage condition = Drained
- Loading Direction = Compression
- Maximum Strain = 0.2
- Number of Steps = 50
- Leave other settings as default. The dialog should look as follows:
- Click OK to save and close the dialog.
- Select
 Apply Test Simulation.
 - In the Apply Test Simulation dialog, select the material “OC-Clay-v” and assign “TC-100.”
- Click OK to save and close the dialog.
- Select
 Apply Test Simulation again.
 - In the Add Test Simulation dialog, select the material “HOC-Clay-v” and assign “TC-100.”
- Click OK to save and close the dialog.


2.2.2 Define Stress Path
We need to define two more stress paths.
- Select
 Define Stress Path.
 - In the Define Lab Stress Paths dialog, click the
 Add icon to add a second stress path.
 - Select “Path 2” and rename it to “Analytical-OC”.
- Enter the following parameters:
- Test Type = Triaxial Test
- Seepage condition = Drained
- Loading Direction = Axial
- Leave other settings in the dialog as default.
- Copy and paste the data from column A through C to the dialog data section.
- Click the
 Add button again to add another stress path.
 - Rename “Path 3” to “Analytical-HOC”.
- Enter the following parameters.
- Test Type = Triaxial Test
- Seepage condition = Drained
- Loading Direction = Axial
- Copy and paste the data from column A through C to the dialog data section.
- Leave other settings in the dialog as default. The dialog should look as follows:
- Click OK to save and close the dialog.
- Select
 Apply Stress Path.
 - In the Apply Stress Path dialog, assign “Analytical-OC” to “OC-Clay-v” material as shown below.
- Click OK to save and close the dialog.
- Select
 Apply Stress Path again
 - In the Add Stress Path dialog, assign “Analytical-HOC” to “HOC-Clay-v” material as shown below.
- Click OK to save and close the dialog.
The stress path data can be found in Excel csv file: “stress-#013 – drained triaxial test (constant v) – OC Clay.csv” as follows:

The dialog should look as follows:

The stress path data can be found in Excel csv file: “stress-#013 – drained triaxial test (constant v) – Highly OC Clay.csv” as follows:


Note that the Initial Effective Lateral Stress is 200 kPa for Analytical-NC, while that is 100 kPa for Analytical-OC and Analytical-HOC.


Now the material models, test simulations, and stress paths are properly assigned to three materials. The visibility tree should look as follows:

2.2.3 Results
Ensure the Stress Path Graphs tab is selected at the bottom of the program. We now can view the results.

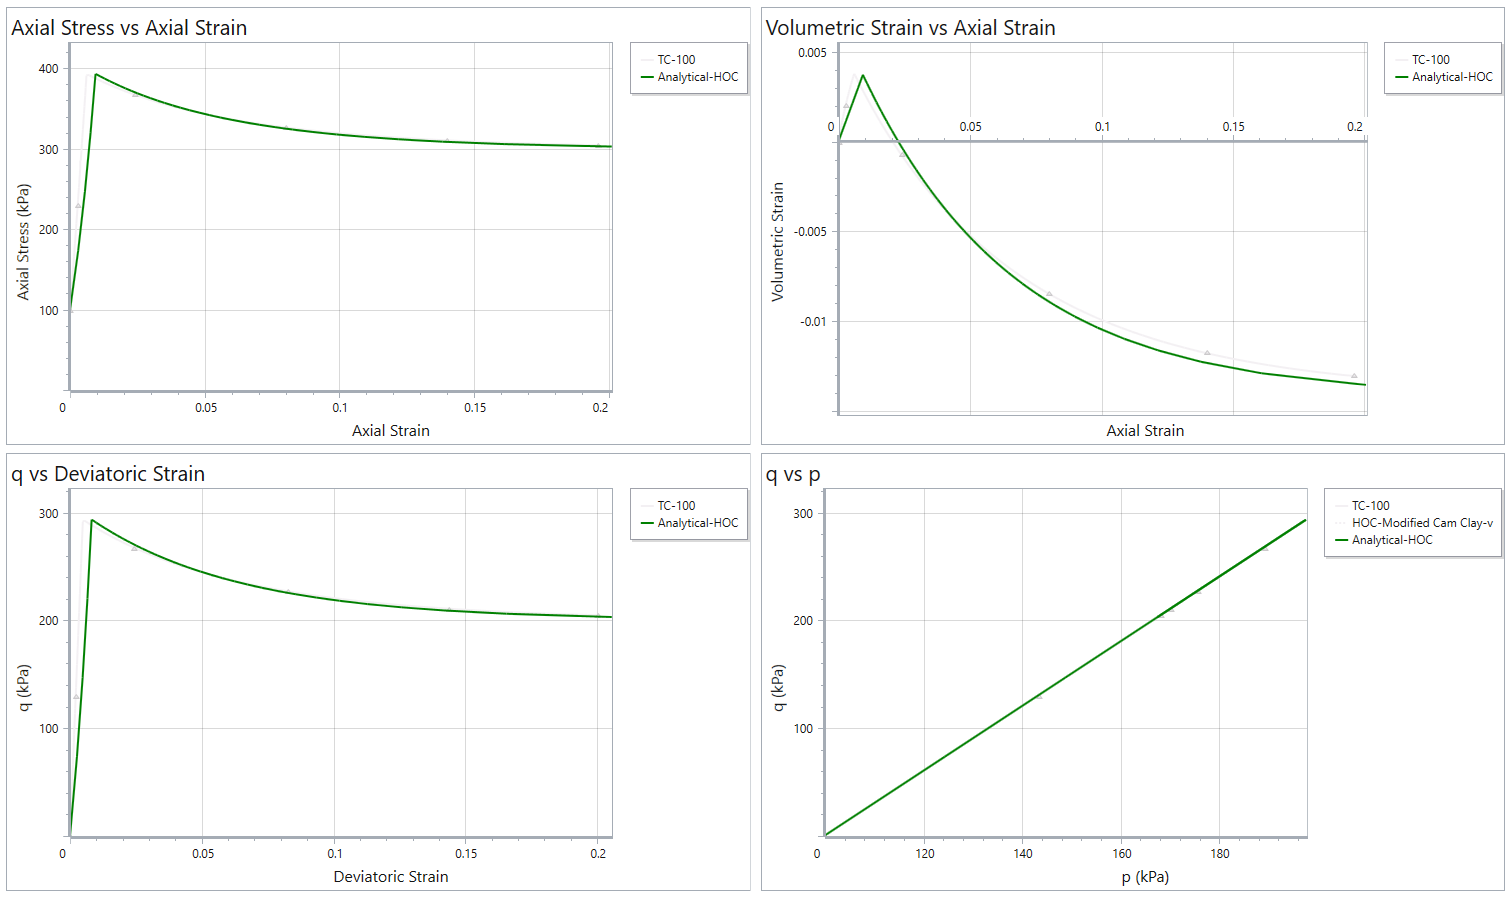
Let’s turn off “N-Clay-v” and “OC-Clay-v” by clicking the  beside the material and leave on “HOC-Clay-v”. The program should display as below.

For “HOC-Clay-v” material, on the q vs Deviatoric Strain graph, both lines raise up to near 300 kPa first, and then smoothly decline to around 200 kPa. It is worth noting that there are only four data points consisting the first portion of test simulation curve (TC-100). In order to investigate the behaviour in more detail, we will adjust the maximum stress increment ratio.
- Select
 Project Settings.
 - In the Project Settings dialog, expand Solution Algorithm section.
- Select the checkbox for Maximum Stress Increment Ratio and enter value 0.05.
- Click OK to save and close the dialog.
This action decreases the increment ratio from 100% to 5%. The dialog should display as follows:

Now the number of data point for TC-100 has increased, which increases the accuracy of the path.

As seen from the four graphs, for over-consolidated clay, the grey line (TC-100) matches with the blue line (Analytical-OC); for highly over-consolidated clay, the pink line (TC-100) matches with the dark-orange line (Analytical-HOC).
Combine with the same situation found for normally consolidated clay (section 2.1.4 Results), it can be concluded that for the three types of modified cam clay, the RSData test simulation results matches with the experimental/lab simulation data in spread sheets.
The other Modified Cam Clay model with constant shear modulus (instead of constant Poisson's ratio) is also included in the tutorial folder. This is left as additional exercise. The results for constant shear modulus model should appear as shown below, which is same as constant Poisson's ratio model:

This concludes the RSData Modified Cam Clay Model tutorial.

