Graph Lambda vs. FS
The Graph Lambda vs. FS option uses the global minima surfaces generated by analyses using either Spencer’s method or the GLE method to generate a graph of safety factor versus lambda. The graph captures the range of explored lambda values and displays the converged upon value from the iteration of force and moment equilibrium calculations.
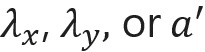
Lambda (λ) is used to scale the intercolumn normal force in the x- and y-directions:
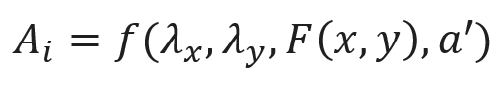
Where ![]() is a component of the stress calculations for column i (it is used to calculate the base normal and shear stresses in a column). Lambdas are scaling factors that are determined iteratively to satisfy force and moment equilibrium. a’ represents the sliding direction of the failure mass (measured degrees clockwise from the positive y-axis). F(x, y) is a function of the x and y position of the soil column, and like the lambdas, is used to scale the intercolumn normal force.
is a component of the stress calculations for column i (it is used to calculate the base normal and shear stresses in a column). Lambdas are scaling factors that are determined iteratively to satisfy force and moment equilibrium. a’ represents the sliding direction of the failure mass (measured degrees clockwise from the positive y-axis). F(x, y) is a function of the x and y position of the soil column, and like the lambdas, is used to scale the intercolumn normal force.
These values are used in the more comprehensive Spencer and GLE methods of columns, but both approach the solution differently. Spencer’s method assumes a constant function, F(x,y) = 1.0. The GLE method assumes a function as defined in Project Settings > Methods > Intercolumn Force Function. It is assigned to half sine by default. For more information, see Slide3 Theory Overview.
For these methods in 3D, the factor of safety is found when both force and moment equilibrium conditions are satisfied. This is solved as a series of equations with the following convergence conditions:
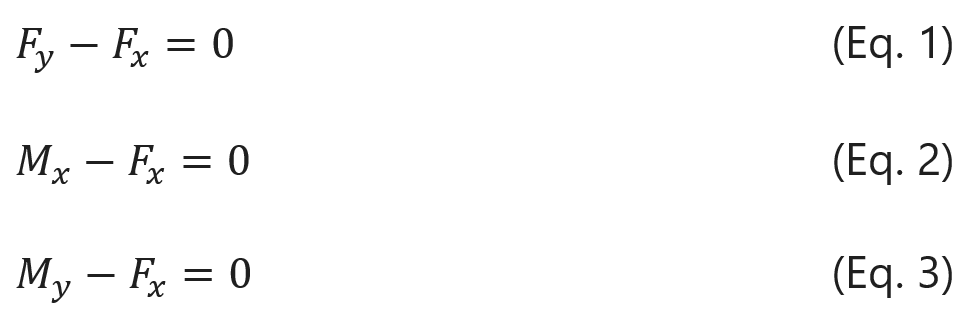
Where F is the force factor of safety and M is the moment factor of safety. All four of the above terms are functions of ![]() across all columns i of the failure mass. The equilibrium is reached when all the equations are within the specified tolerance of zero (see Tolerance in Project Settings) using the same input values
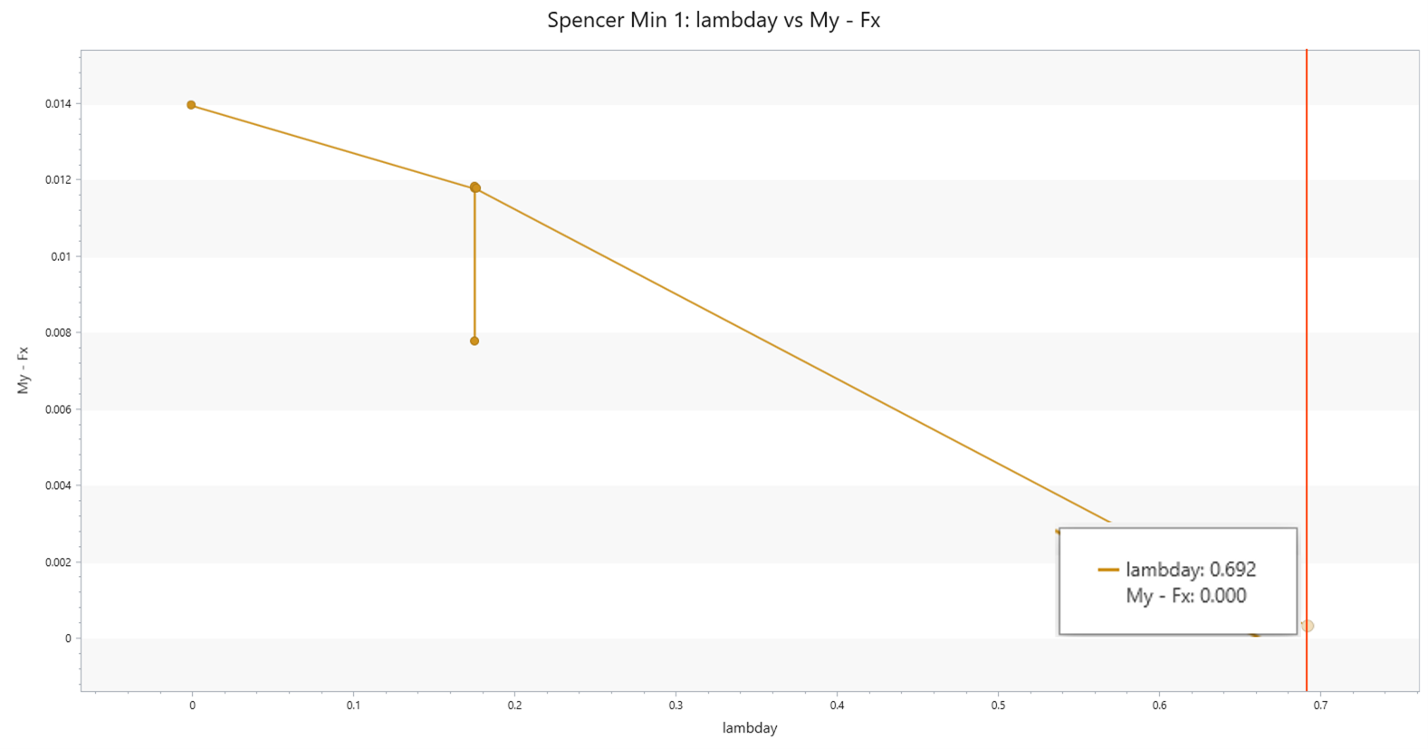
across all columns i of the failure mass. The equilibrium is reached when all the equations are within the specified tolerance of zero (see Tolerance in Project Settings) using the same input values 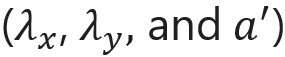 . Below is an example of Eq. 3 plotted against
 ![]() . The points don’t form a smooth curve because all the equations are solved simultaneously using a non-linear solver. The equations converge at
. The points don’t form a smooth curve because all the equations are solved simultaneously using a non-linear solver. The equations converge at 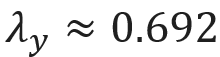 .
.
To use the Graph Lambda vs. FS option:
- Compute slope stability results.
- Select Interpret > Graph Lambda vs. FS from the main menu.
- You will see the following dialog.
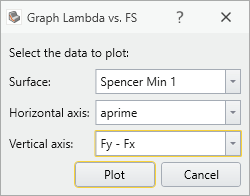
- Select the desired global minimum surface in the dialog (see below for details), desired axis variables (
 for the horizontal axis; Eq. 1-3 for the vertical axis) and select Plot to create a graph in Slide3.
Data to plot
Each global minimum surface will have available Lambda vs. FS data to plot. You can select one surface at a time to plot.
Plot
Use the Plot button to generate a graph in Slide3. Once a graph is generated in Slide3, it can be customized with the Chart Properties or Change Plot Data options, as described below.
Plot in Excel
You can use the Plot in Excel button to generate a graph in Microsoft Excel. The following will occur if you select Plot in Excel:
- The Microsoft Excel ä program will automatically be launched (if you have Excel installed on your computer).
- The raw data used to generate the graph, will be exported to an Excel spreadsheet.
- The graph will be created in Excel.
You can then customize the graph or process the data as desired in Excel.
Copy Data to Clipboard
If you select the Copy button, the raw data used to generate the graph, will be copied to the Windows clipboard. From the clipboard, it can be pasted into other applications for report writing, or further data processing etc.
Customizing a Graph
After a graph has been created, various options are available to the user to customize the graph data and appearance.
Change Plot Data
If you click Change Plot Data, this will display the Lambda vs. FS dialog, allowing you to change the Data to Plot parameters.