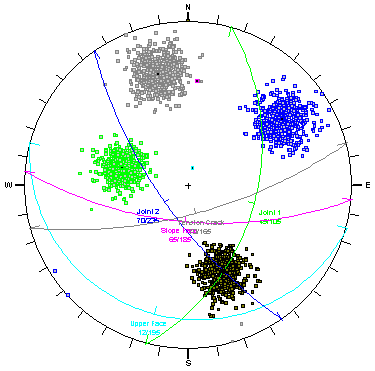
Stereonet View
The Stereonet View  option displays a stereographic projection of your wedge orientation data.
For an overview of the Stereonet View option, see the Stereonet View topic.
The features of the Stereonet View applicable to a Probabilistic analysis are highlighted below. These options are available in the right-click menu of the Stereonet View.
Show Planes
The Show Planes option will display the planes (great circles) corresponding to the current orientations of Joint1, Joint2, slope, upper face and tension crack.
- For a Probabilistic analysis, the mean wedge orientations are displayed by default.
- If you have selected a random wedge (e.g. on a Histogram plot) or the minimum safety factor wedge, then the Stereonet View will display the planes of the current wedge.
Show All Poles
For a Probabilistic analysis, the Show All Poles option will display all randomly generated pole orientations for wedge planes with statistical distributions. The poles corresponding to the mean wedge, selected wedge or minimum wedge are also displayed.
Show Intersections
The Show Intersections option toggles the display of joint intersections on the stereonet. A joint intersection is the orientation of the line of intersection of two joint planes forming a wedge.
Show Failed
The Show Failed option highlights all intersections and corresponding joint poles, which represent a wedge with a safety factor < 1. The Show All Poles or Show Intersections options must also be selected in order for this option to apply. Failed orientations are highlighted in red.
TIP: If you set the Random Numbers option (in Project Settings) to Random (instead of Pseudo-Random), and repeatedly press Compute, the Stereonet View will display a new set of randomly generated orientations each time you press Compute.
