Exploring Advanced Techniques for Geotechnical Risk Mitigation in the African Copperbelt
One of the many challenges to open pit and underground mine designs is the high variability of weak rocks in weathered sedimentary deposits. Probabilistic analysis is the most valuable tool to quantify the risk level of a slope, and spatial variability modeling further adds to its effectiveness. By considering strength properties as spatially variable, the natural properties within the rock mass can be better simulated, yielding a more realistic variation of strength along a critical shear surface.
Probabilistic analysis with input parameters as spatially random variables can help you estimate a more accurate probability of failure than with traditional methods. This study demonstrates a probabilistic analysis with spatial variability using Rocscience’s 2D Limit Equilibrium software Slide2 within oxide zone deposits in the Central African Copperbelt.
Overview of the Central African Copperbelt
The Central African Copperbelt (CACB) includes a series of sediment-hosted copper-cobalt deposits consisting of ore and waste rocks including dolomites, slit-stones, limestones, and sandstones that are variably bedded, brecciated, and altered. To understand the diverse characteristics of the Copperbelt materials, spatial variability modeling is taken into consideration.
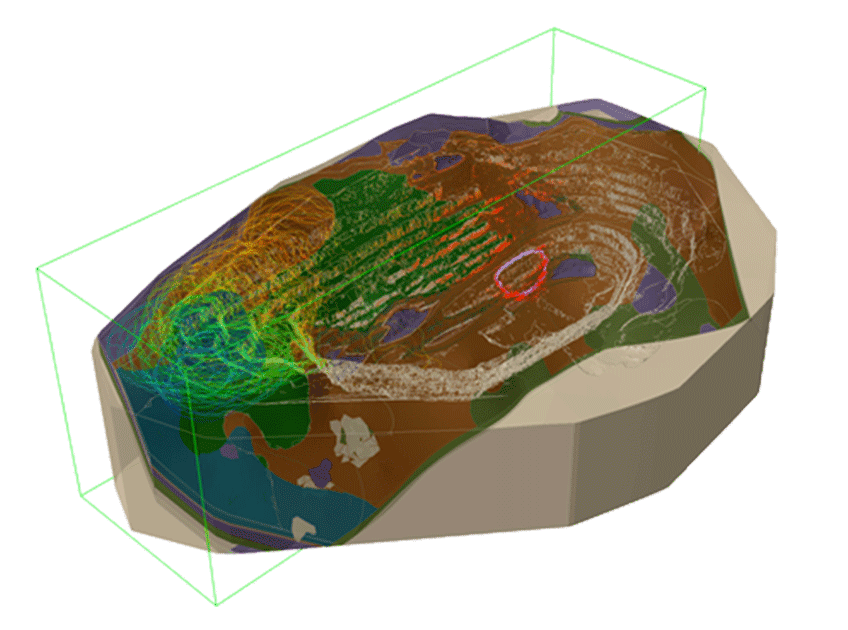
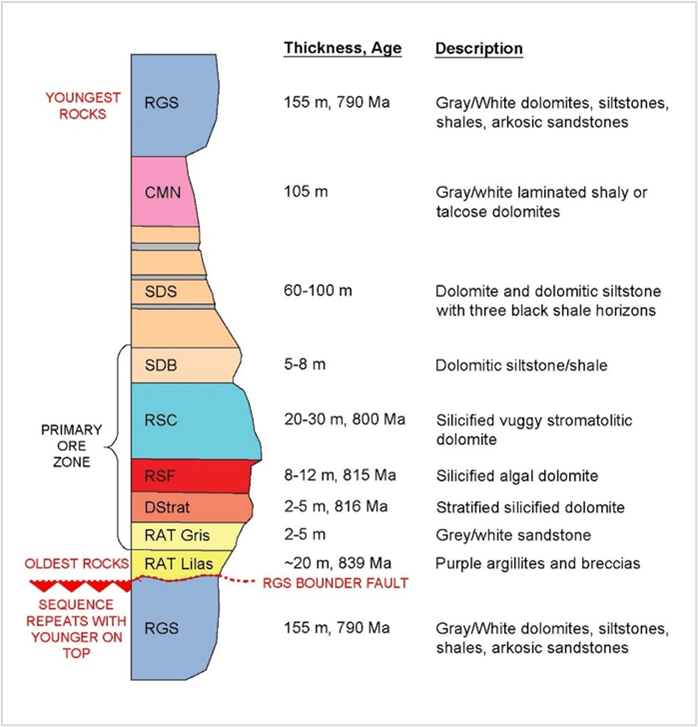
Figure 1 shows how slope stability is controlled by bedding orientation, faults, rock strength, and groundwater. Most deposits typically consist of a footwall containing SDS and CMN rock types and are separated by the RAT/RGS contact fault.
Rock-mass classifications and strength estimation with GTR
An index of rock quality can be obtained with the help of a geotechnical rock type (GTR) classification system. This system is designed to identify the strength parameters in soft rocks when mining the oxide portion of the deposits. The GTR classification system considers hardness, talc content, and recovery of soft rocks.
Table 1. Illustrates the parameters incorporated into 3D block modeling and are applied to define geotechnical rock types and domains.
Geotechnical Rock Type |
Talc Index* |
Calculated GTR** |
Description |
GTR-T |
1-3 |
-1 - 6 |
High talc content |
GTR0 |
0,4 |
≤ 0.5 |
Soil-like material |
GTR1 |
0,4 |
≤ 1.5 |
Friable, weak rock |
GTR2 |
0,4 |
≤ 2.5 |
Transition rock |
GTR3-6*** |
0,4 |
≤ 3.5 |
Hard rock |
Table 1. GTR classification system
*0-no talc, 1-massive talc, 2/3-talc along bedding, 4-traces of talc
**C_GTR = (1-%Recovered)*0 + (% ≤ S6)*-1 + (% ≤ R2)*1 + (% > R2)*Hardness
*** GTR3-GTR6 grouped as one strength for analysis
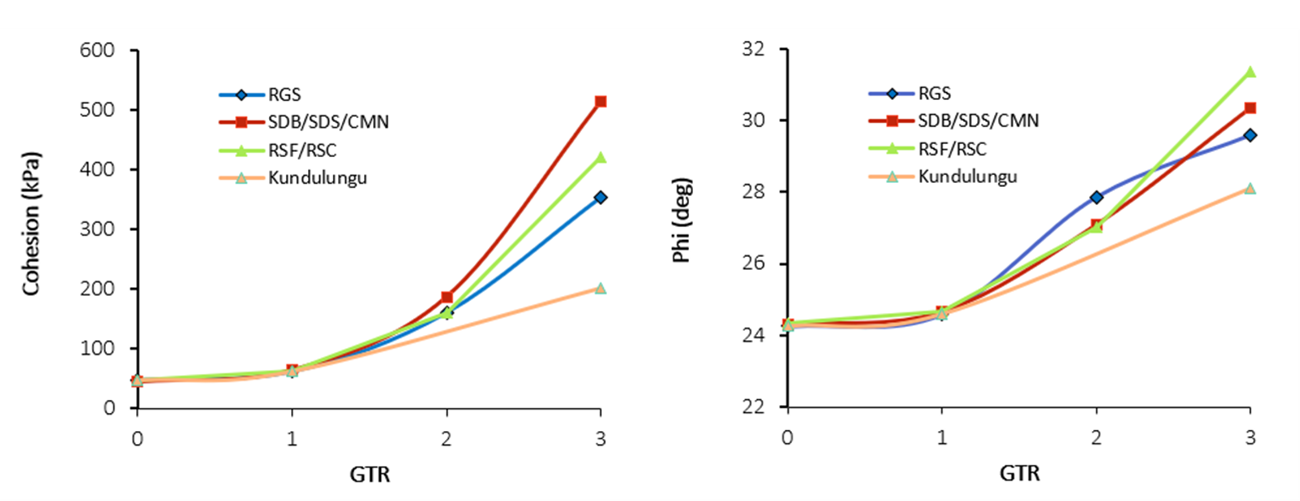
Cohesion and friction angle values can be assessed for an individual drill composite by utilizing functions that estimate the shear strength in between the integer values of GTR for each rock type as shown in Figure 2.
Probabilistic analysis with spatial variability
The application of spatial variability of the soil properties in a probabilistic analysis can be a useful method for an in-depth understanding of slope stability risks associated with a mining project. This study features cohesion and friction angle as spatially variable elements and keeps unit weight constant.
Estimation of the input properties -
- The mean value (µ) is estimated from the model blocks of cohesion and friction angle within each geotechnical domain. The block model is known to be the best mean estimator of the values of cohesion and friction angle for a zone of interest.
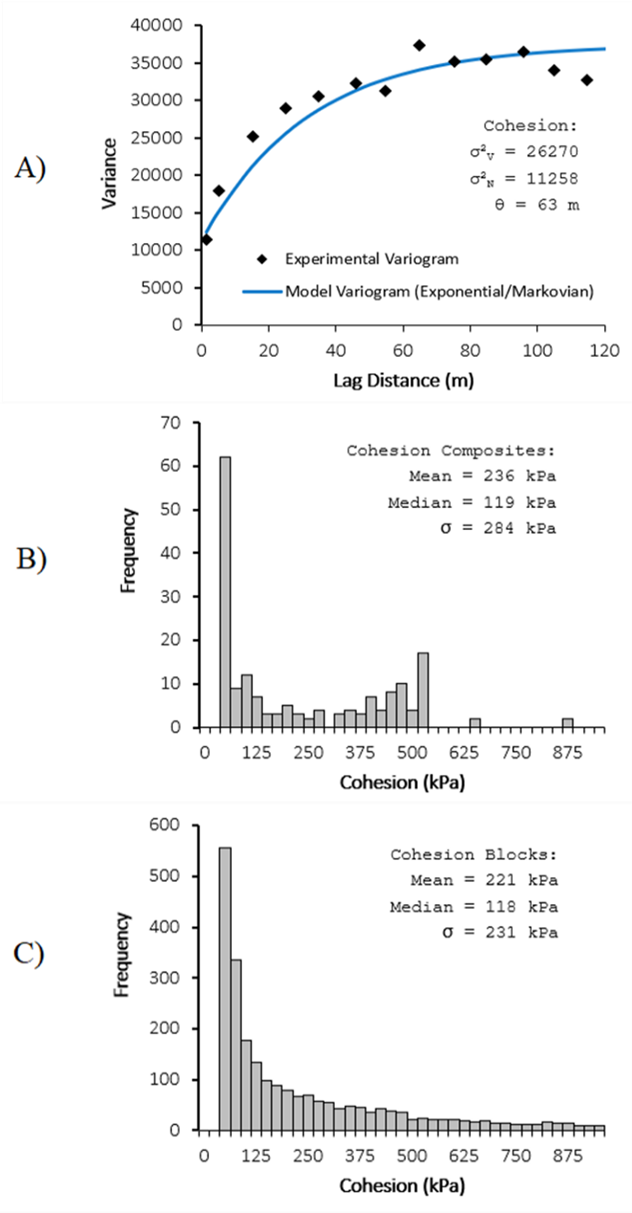
- The distribution type is measured from the distribution shape of the drill hole composites of cohesion and friction angle. Figure 3 shows rock type distribution in weathered zone 2.
- The correlation coefficient between cohesion and friction angle is estimated from cohesion and friction values of the drill hole composites.
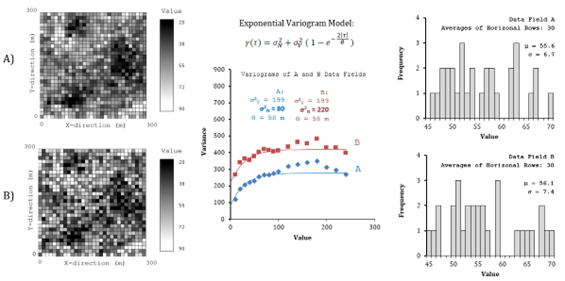
- The long-scale variance (σV2 ) is used as the input variance in this spatial analysis and is estimated by fitting a variogram model.
- The correlation distance (θ) is estimated by fitting a variogram model
It is important to note that the variance and correlation distance of a parameter shouldn’t be estimated through a block model as block interpolation methods may not preserve the variance present in the raw data. While running a slope stability analysis with spatial variability, only the long-scale variance of the data must be considered (not the nugget effect variance). The nugget variance doesn’t contribute to the variance of a spatial average; therefore, the nugget variance is not required in a slope stability analysis with spatial variability.
Results of the simulation
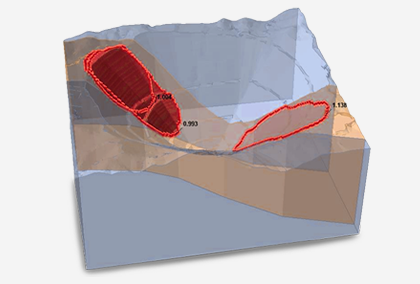
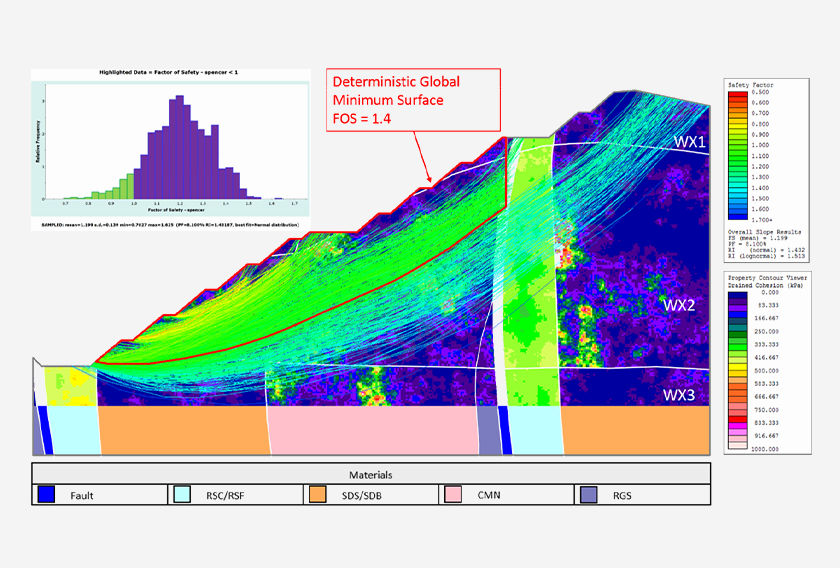
The spatially variable probabilistic analysis with 1000 spatial simulations can be seen in Figure 5. Each of these 1000 simulations highlights a global minimum critical slip surface that is likely present along the weakest material regions for that simulation. The deterministic global minimum FOS value is 1.4 in red, the mean probabilistic FOS value is 1.20, and the probability of failure is 8.1 percent.
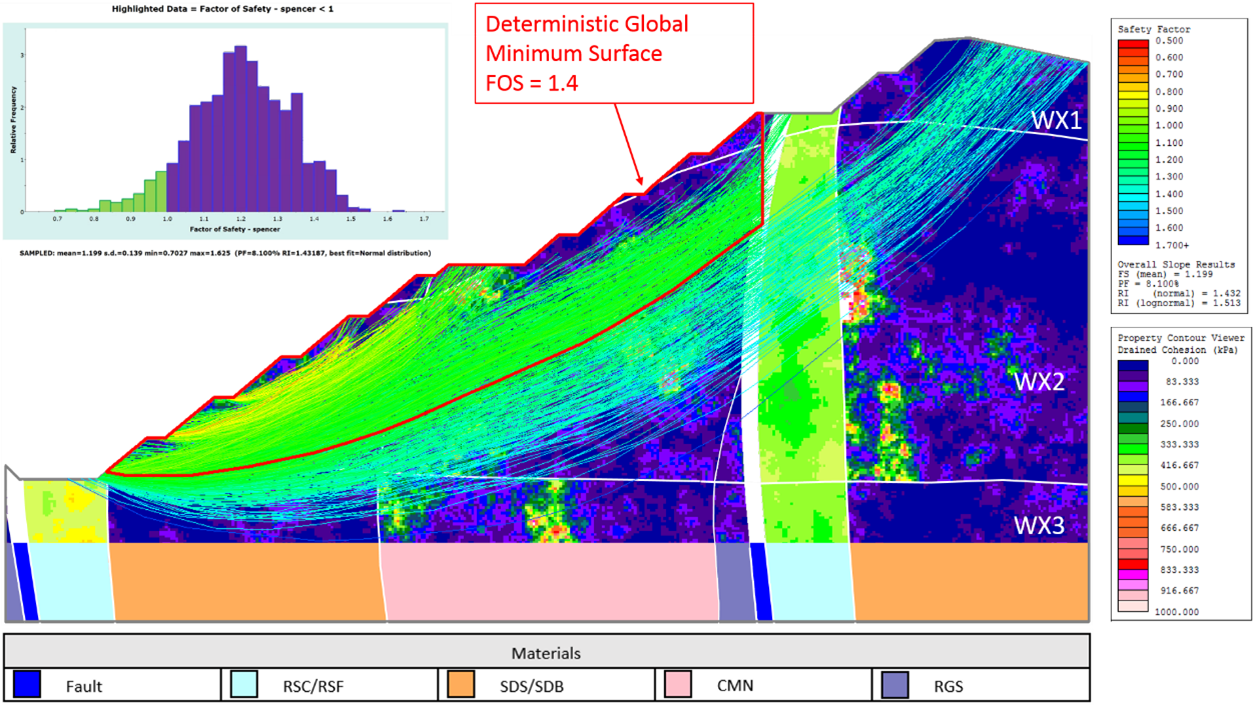
This analysis shows a significant improvement in discovering several potential critical failure mechanisms. Further, several critical surfaces with low FOS values are found on the lower slope and they correspond to a different failure mechanism than the deterministic minimum surface.
The final breakthrough with Slide2’s spatial variability modeling
When it comes to uncovering potential slope failure risks, probabilistic analysis is indispensable to the mining industry – especially, when the risk between multiple mine plans can be directly and quantitively compared. This study precisely focuses on sources of potential uncertainty through a probabilistic analysis with spatial variability modeling in Slide2 on an open pit mine.
Using spatial variability, thousands of simulations are obtained, which leads to discovering multiple potential failure mechanisms. While the deterministic analysis shows higher global minimum FOS values, the probabilistic evaluation identifies lower mean FOS value for several critical surfaces, helping this experiment reach accuracy in detecting probable risk factors.
Read the full paper to understand how this advanced probabilistic analysis is carried out.