Here's How to Present SPT Results with RSLog
- Alireza Afkhami, Senior Manager, Web Applications at Rocscience
The Standard Penetration Test (SPT) is a cornerstone of geotechnical engineering that provides valuable insights into soil density and consistency, and presenting SPT results efficiently can significantly impact your project outcomes. That’s where RSLog comes in; it streamlines the process of adding SPT results to your borehole logs with precision and ease.
For those new to the field, the SPT involves driving a sampler into the soil with a hammer and recording the number of blows (N-value) it takes to penetrate 12 inches (300mm). This N-value is crucial for various design purposes, including foundation design, settlement analysis, and more.
The American Society for Testing and Materials (ASTM) has standardized this procedure, ensuring consistency in SPT data collection worldwide. Typically, both individual N-values and penetration depths are recorded.
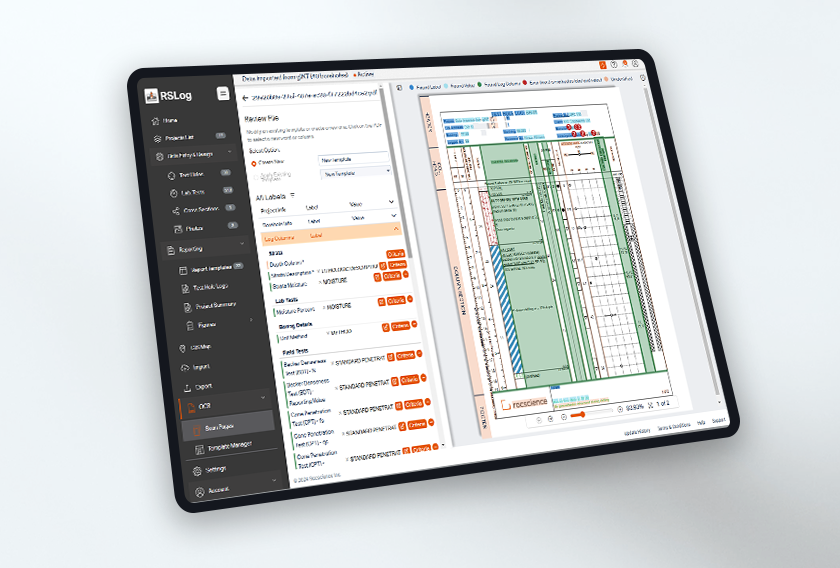
RSLog’s flexible data structure allows you to tailor data entry columns to your needs, so whether you require only one column for the SPT blow count or multiple, you can customize your setup. To configure your SPT data fields, navigate to Settings > Field Investigation > Field Tests.
Presenting SPT Blow Counts as a Number
SPT blow counts may be shown in the borehole log in different ways depending on the details collected during site investigation. The following table summarizes these options:
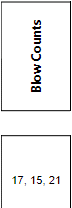
Appearance on the Log |
Log Template Design |
Data Entry Method |
|
Add a Text/Number » Field Test Results log column and link it to the Reporting Value of your SPT test. |
Use Reporting Value column as shown below. This column allows alphanumeric values (e.g. use of comma etc.) 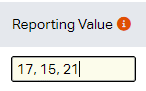 |
|
Add a Text/Number » Field Test Results log column and link it to the Reporting Value of your SPT test. |
Use Reporting Value column as shown below. Use the Split Character between the numbers to force the data to show in multiple rows in the log. 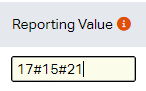 |
Note: Use the ‘split character’ (see Settings page > Data Entry tab > SPT Rules tab) to force the SPT data entered in the Reporting Value column to split into multiple rows. 
|
||
|
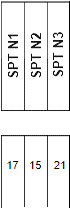
Add 3 separate Text/Number » Field Test Results log columns and link them to corresponding columns of your SPT test. |
Enter data in separate columns. You can customize the columns of your field tests to accept data in multiple columns. 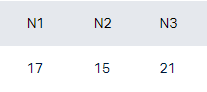 |
Presenting SPT Blow Counts on a Graph
SPT blow counts may be shown in the borehole log in different ways depending on the details. The following table summarizes these options:
Appearance on the Log |
Log Template Design |
Data Entry Method |
A graph showing SPT blow counts only. 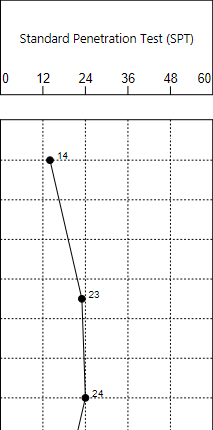
|
Add a Graphic » Field Test Results log column and link it to the desired data column (e.g. N60) in your SPT field test. |
Enter blow count details in separate columns. You can customize the columns of your field tests to accept data in multiple columns. 
|
A graph showing SPT blow counts along with other field and lab tests. 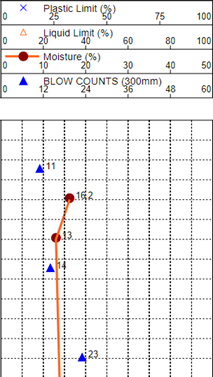
|
Add a Graphic » Graph (customizable) log column and add different data series linked to the desired data sources (e.g. various field / lab tests). |
Enter blow count details in separate columns. You can customize the columns of your field tests to accept data in multiple columns.
|
Streamline Your SPT Results Presentation
Incorporating Standard Penetration Test (SPT) results into your borehole logs has never been easier, thanks to RSLog.
With its flexible data structure and customizable settings, the software empowers geotechnical engineers to present accurate and detailed SPT data for reliable designs. Whether you require single or multiple column entries for SPT blow counts, RSLog adapts to your needs, ensuring your logs are both accurate and comprehensive.
Looking for an easier way to add SPT blow counts to your borehole logs?
Start your free trial of RSLog today!