How a Digital Twin of the Pueblo Viejo Gold Mine Helped Manage Slope Failure
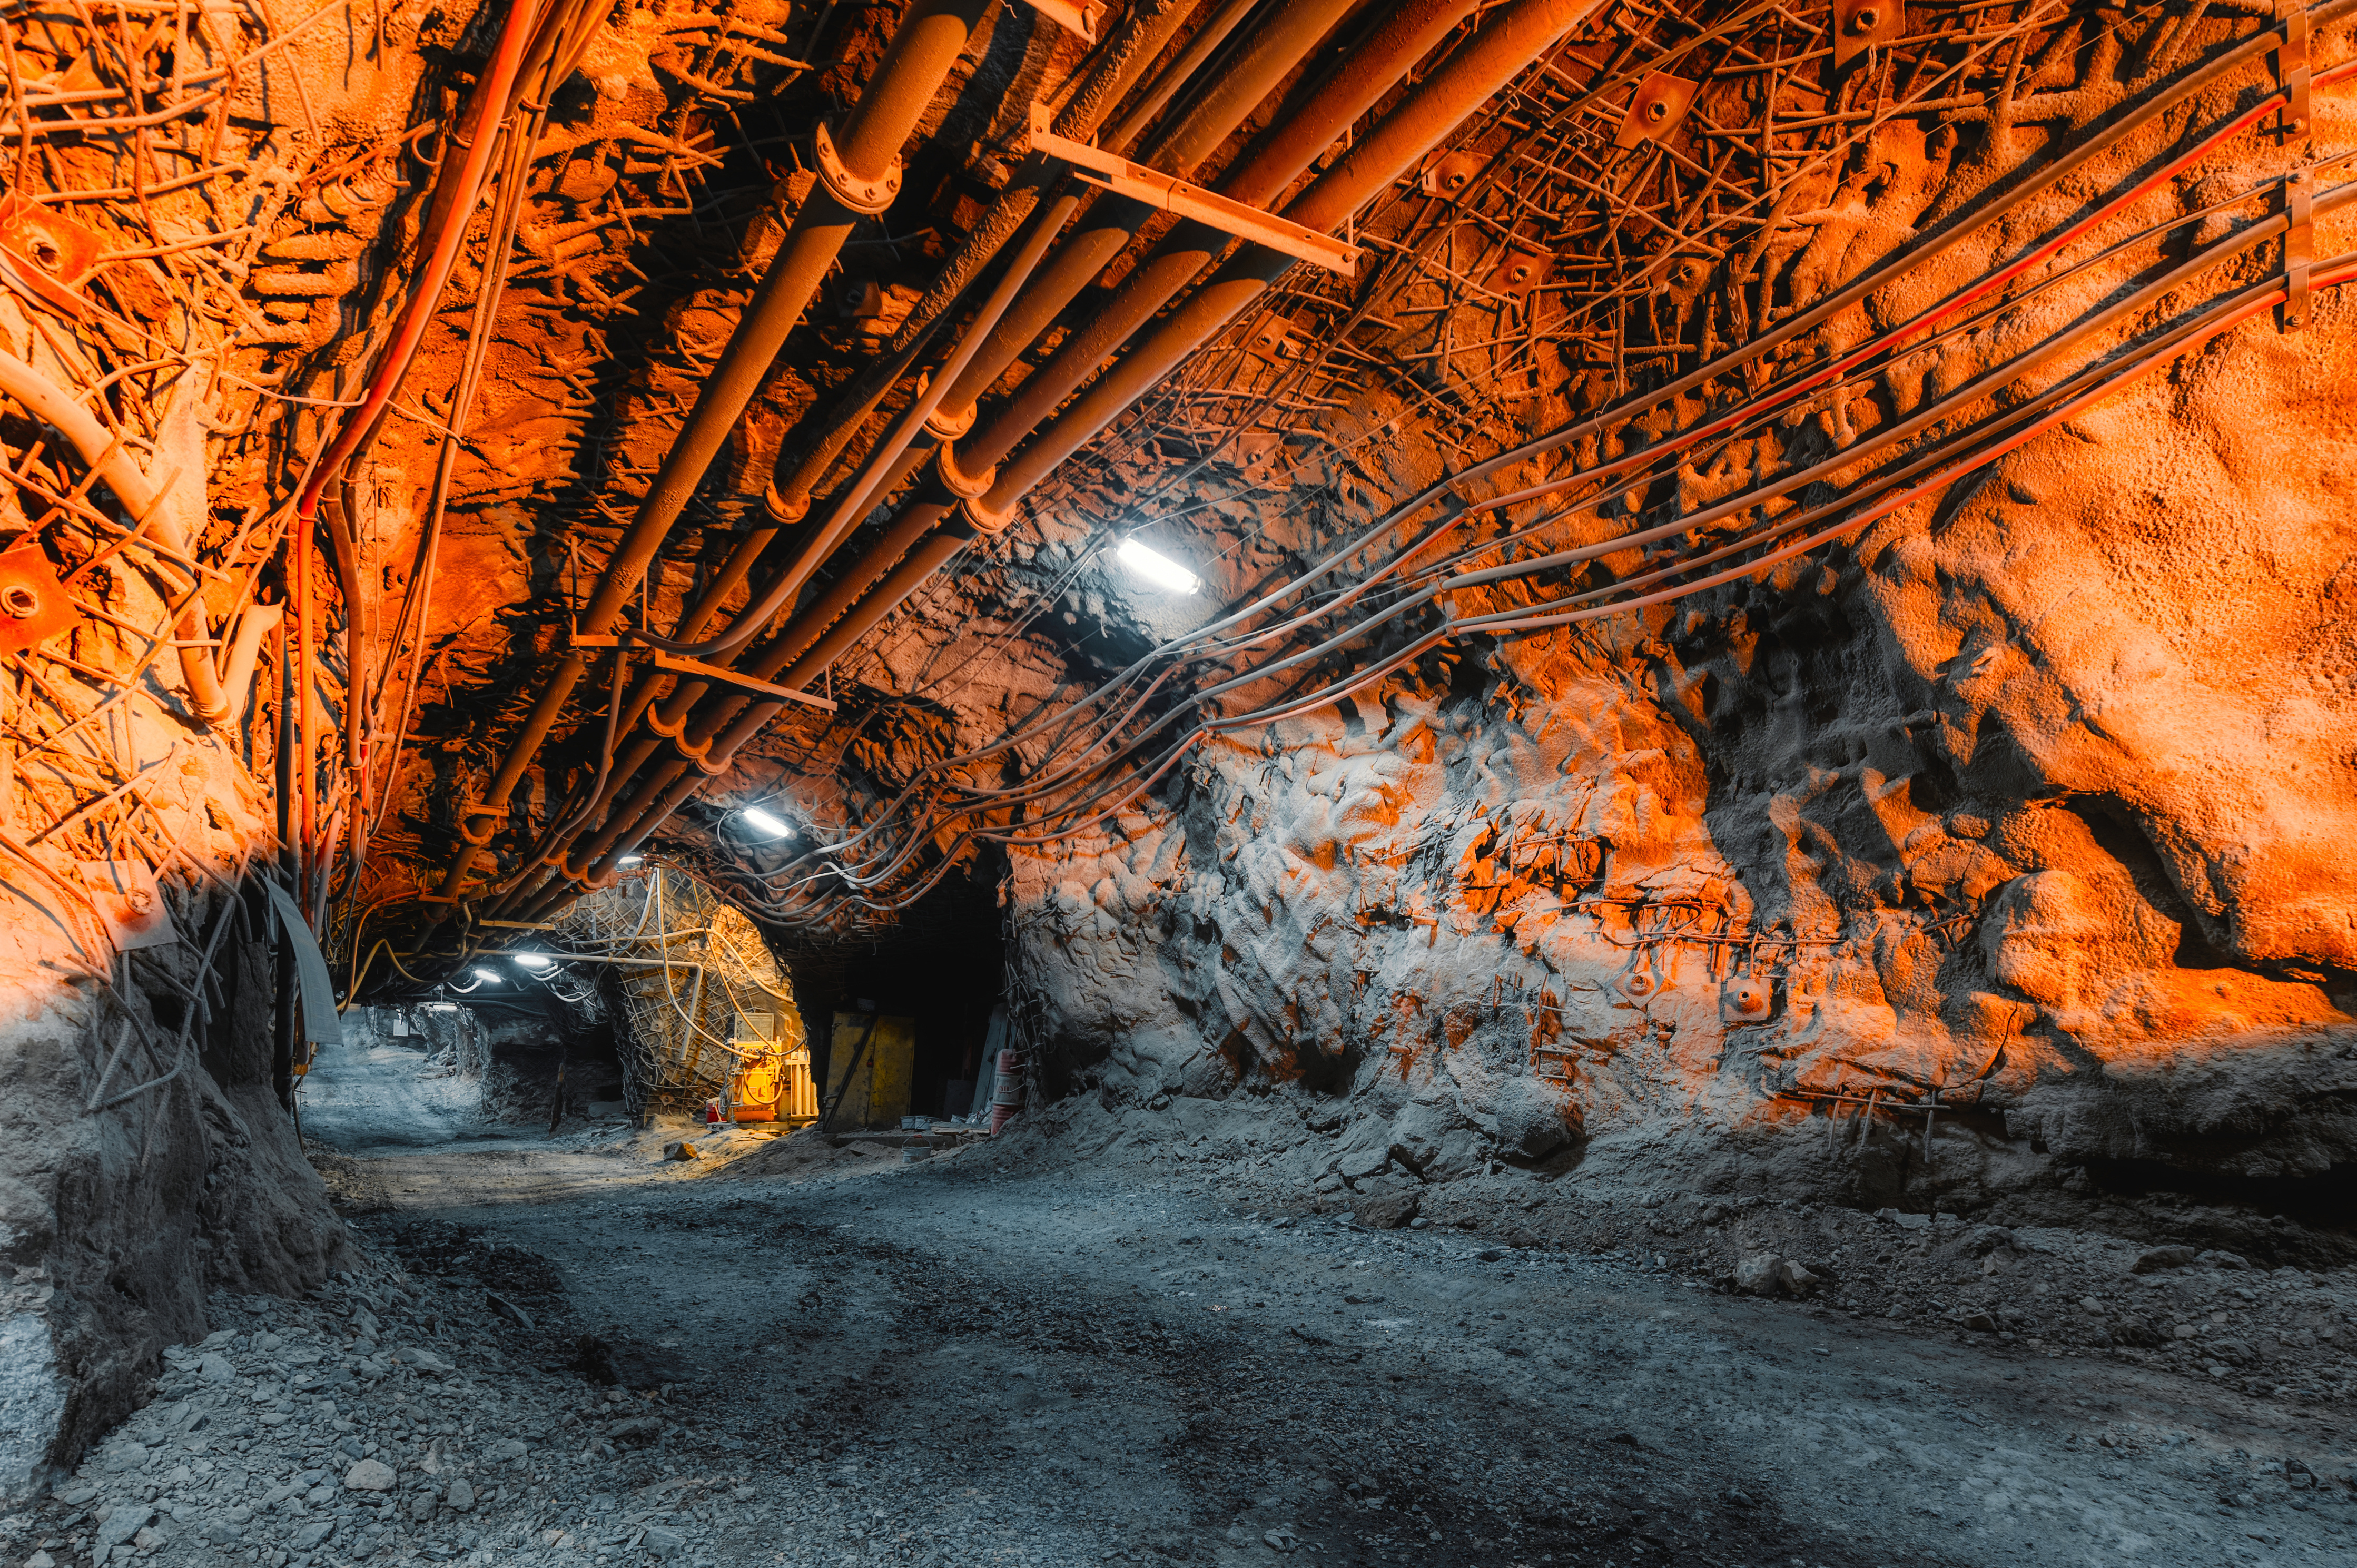
Beneath the tropical landscape of the Dominican Republic, the interaction between weak carbonaceous sediments and volcanic tuffs kept the Pueblo Viejo gold mine’s engineers on alert for slope instability.
Initial 3D limit equilibrium (LE) modelling detected a low factor of safety (FoS ~1.07) in the upper carbonaceous sediments that signaled a risk of slope failure. This risk was identified early, and engineers decided it could be managed at an operational level, but proceeding without a substantial slope redesign required a new approach.
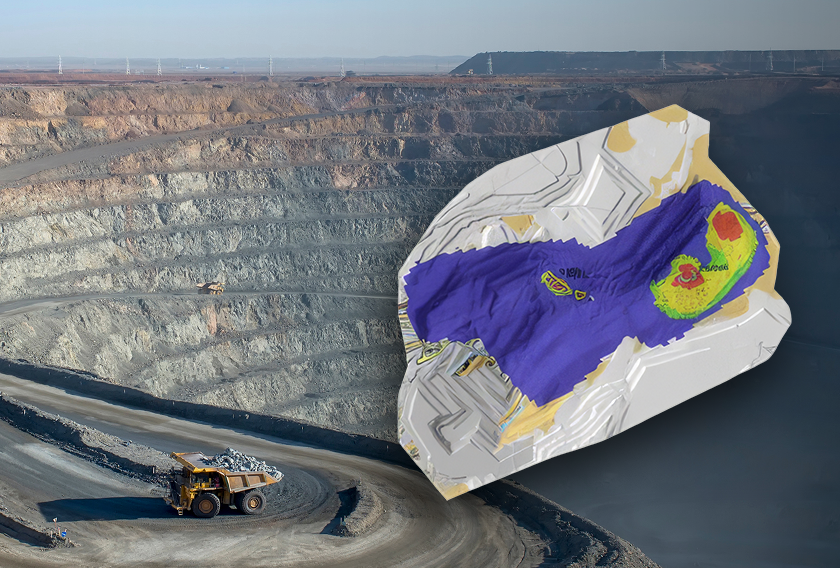
Engineers implemented a digital twin, built with our 3D limit equilibrium modelling software Slide3 and mapping conducted with ShapeMetriX. With this approach, they identified a 20m high double-bench section of moving slope that progressed to a semi-brittle collapse.
Here, you’ll learn how digital twin technology in mining, built using our slope stability and mapping software, helped identify and manage the collapse in Moore Pit. For the full story, read the original case study.
The Site Conditions
3D slope stability analysis was routinely utilized at the Pueblo Viejo mine, where the geological setting is highly anisotropic after several phases of thrust faulting and hydrothermal alteration through its depositional history. Located in the tropics, the region also experiences high rainfall, which site geotechnical engineers considered in their designs and operational response protocols.

The Requirement for a Digital Twin
The initial Slide3 model developed for Pushback 15 of the Moore Pit identified a low (1.07) FoS slip surface in the highly anisotropic carbonaceous sediments (UCS and LCS units). The design acceptance criteria on site is 1.2. In this case, instead of requiring a substantial redesign, the risk of slope failure was determined manageable at the operational level with the implementation of a digital twin.
What Is a Digital Twin, and How Was It Implemented?
Digital twins are real-time virtual models that mirror the physical conditions of a system — in this case, the slopes of the open-pit mine. They combine real-time monitoring data with predictive modelling to create a live model of the physical system. The digital twin is updated as conditions change, so that engineers can make informed decisions based on the most current data.
A geotechnical engineer, for example, could integrate data from aerial or terrestrial photogrammetry, ground-based radar, and other monitoring systems into a 3D model that simulates slope stability. Then, they can compare predicted conditions with real-time data to proactively manage risks.
At the Pueblo Viejo mine specifically, digital twin requirements included routine mapping, modelling, and monitoring. Structural and rock mass mapping using aerial photogrammetry and face mapping was completed for every 20 m of vertical advance using ShapeMetriX. Updates to the Slide3 model were then completed as newly uncovered geotechnical conditions were identified. Concurrently, radar and 24/7 monitoring of operations were consistently monitoring the slope for deformation.
The Insights
The digital twin mapping requirements identified a set of low-angle faults and shears within the tuffaceous FDT unit. These features had not been identified at the time of the initial 3D slope stability modelling. When included in the 3D digital twin model, a new potential failure surface was identified.
Displacement maps generated from drone photogrammetry data verified the slip surface and helped define the spatial extent of the structurally-bound slip surface. Radar monitoring further validated the slip surface, and through 24/7 monitoring when acceleration was detected the pit was evacuated per the site’s response protocol. The resulting slope failure had a volume of approximately 10,000m3.
See below for more details about the methods used and what they accomplished:
Aerial photogrammetry: The surveys provided detailed 3D maps of the pit’s geology that revealed geological faults and fractures that had not been detected in the initial 3D LE model. Several low-angle faults within the FDT were discovered, which was used to predict the slope’s eventual semi-brittle failure.
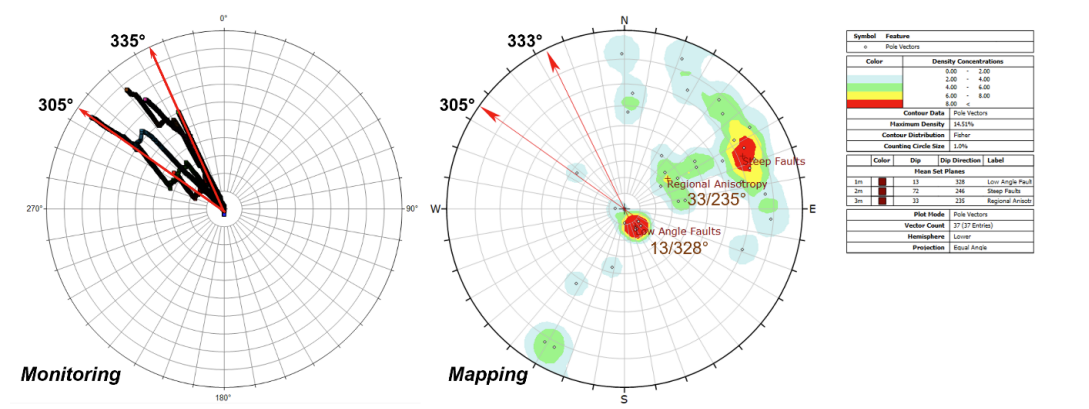
Photogrammetry data was also used to create accurate 3D models in ShapeMetriX from which displacement maps were derived in order to track the predicted semi-brittle failure. Over time, additional data was layered to reveal displacement patterns, helping to estimate and confirm the sub-vertical structures defining the wedge-type failure.
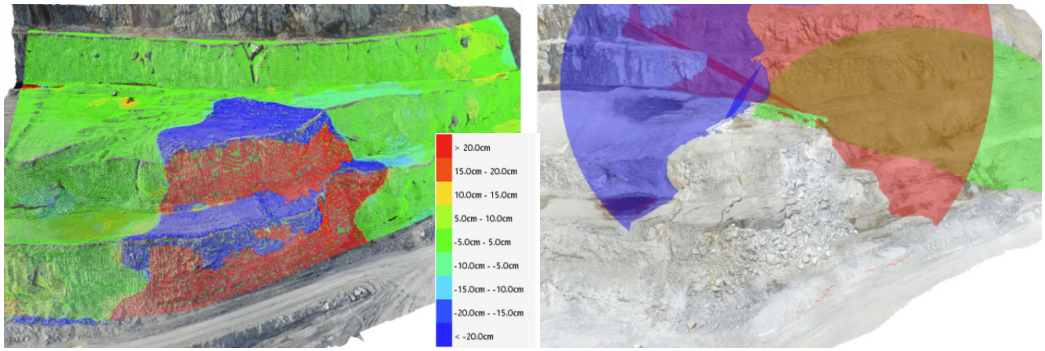
Ground-based radar monitoring: Two radar systems were installed to monitor real-time displacement. The radar captured subtle movements in the slope that standard monitoring could not detect. Around 23 hours before the collapse, the radar began recording accelerating displacement vectors and it signaled an increasingly unstable slope.
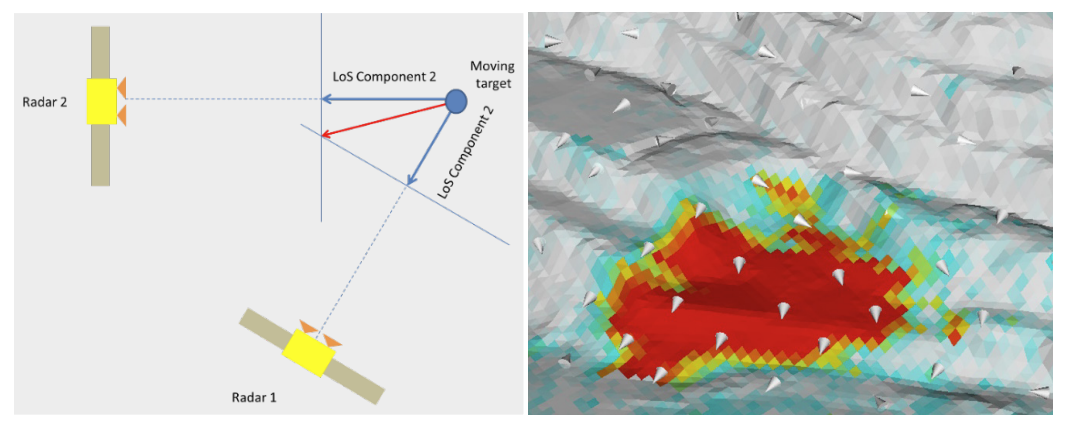
3D limit equilibrium modelling software: Our software was the core of the digital twin. It allowed the team to integrate real-time data into their geotechnical models and constantly refine the slope’s predicted behavior. As new data from the radar and photogrammetry became available, the model was updated, providing an accurate picture of the slope’s stability.
The Verdict
The digital twin developed using Slide3, ShapeMetriX mapping data, and IDS ArcSAR radar monitoring allowed the safe operation through the initially identified low FoS zone in the upper highly anisotropic carbonaceous sediments. The digital twin further identified critical structures and accelerating slope movement in the lower tuffaceous units that eventually resulted in the semi-brittle failure of 10,000m3 of rock mass. Without the mapping, modelling, and monitoring systems required by the implemented digital twin methodology, this high-risk area would not have been proactively and effectively managed.
How to Create a Digital Twin Yourself
In complex environments like the Pueblo Viejo gold mine, establishing a digital twin process is a helpful tool for maintaining mine safety and operational efficiency. You can combine advanced 3D mapping and modelling with real-time data to continuously adapt to geological changes, just as the engineers did when proactively managing the slope failure at Moore Pit. Here’s a brief overview of the steps you can take:
- Map and identify structures: Start by gathering detailed geological data through in-pit face mapping and aerial photogrammetry with a tool like ShapeMetriX. You can accurately identify geological structures, such as faults and fractures, as excavation progresses.
- Build a 3D geotechnical model: Use tools like Slide3 or RS3 to create a detailed 3D model of your site. Incorporate geotechnical data such as anisotropic material properties (e.g., strength, cohesion, friction angle), slope geometries, and groundwater conditions. This model serves as a foundation for the physical condition of your site.
- Integrate monitoring data: Link the model to real-time monitoring systems such as ground-based or satellite radar, piezometers, or photogrammetry. This allows the digital twin to continuously update, reflecting actual site conditions as they evolve over time.
- Perform continuous analyses: With real-time data integrated, you can run ongoing analyses to assess factors like safety, displacement, or stress within the system. This enables real-time evaluation of how the site is responding to excavation or environmental changes.
- Predict and address risks: The digital twin allows you to simulate future scenarios based on updated data, helping you identify and mitigate potential risks before they develop into major issues.
By building a digital twin that evolves alongside your project, you gain the same advantages that helped prevent uncontrolled slope movement at Moore Pit—real-time insights, continuous updates, and the ability to proactively manage risk.
