Refine Your Groundwater Analysis With the New Hydraulic Statistics Feature in Slide2
- Liam Sy, Geotechnical Software Developer at Rocscience
- Sina Javankhoshdel, Senior Manager - LEM
In the upcoming release of Slide2, version 9.035, a new Hydraulic Statistics feature will be added to further expand upon Slide2’s statistical capabilities. With it, you can vary material hydraulic parameters in the same way as existing material strength parameters. This feature is only available if a statistical analysis is on (probabilistic analysis), and the model utilizes FEA seepage analysis (steady state and/or transient stages).
Why is Groundwater Variability Important for Slope Stability?
Considering uncertainty in material parameters is a major component of a probabilistic analysis in slope stability. Slide2 already contains a wide variety of statistical tools for probabilistic analysis, including random and spatial variability of soil strength parameters and the advanced cross-correlation between them. But a critical and often complex component of slope stability is the influence of soil hydraulic properties.
Like material strength, these properties are subject to variability and can impact the pore pressure calculation and the resulting factor of safety. Properly considering groundwater variability is essential for obtaining accurate and reliable results in probabilistic slope stability analysis.
Key Highlights of the New Hydraulic Statistics Feature
- Integrated with random variability, cross-correlation, and spatial variability analyses
- Compatible with existing water models
- Usable in conjunction with existing statistics features including soil strength parameters
- Spatially variable hydraulic parameter inputs are viewable in the property viewer
- New pore pressure results in property viewer for each computed sample
- New hydraulic query - query groundwater results throughout model for each sample
How to Use the New Hydraulic Statistics Feature
After setting the hydraulic parameters while viewing the groundwater tab under Properties > Define Hydraulic Properties you can statistically define relevant hydraulic parameters under Statistics > Hydraulic Statistics.
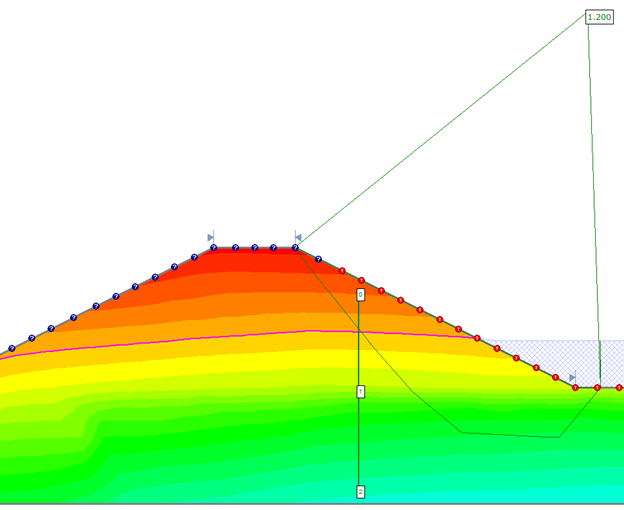
Consider the following model:
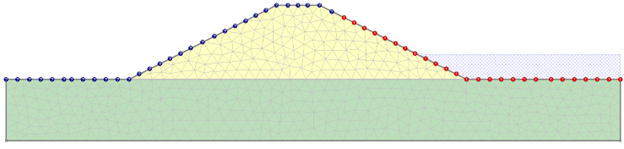
It uses a steady state initial condition with a defined transient boundary condition for multiple stages. We can define hydraulic conductivity (Ks) as a statistical parameter for both the top and bottom materials. Like the existing statistics feature, you can define a standard deviation and relative min and max. While we can run a random variability of the parameter in the probabilistic analysis, we utilize spatial variability which requires only the mean, standard deviation and correlation lengths.
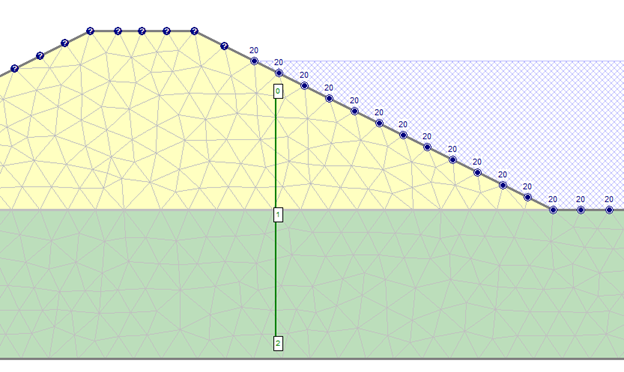
You can view the spatial distribution of the parameter using the property viewer even before computation as shown in the following figure.
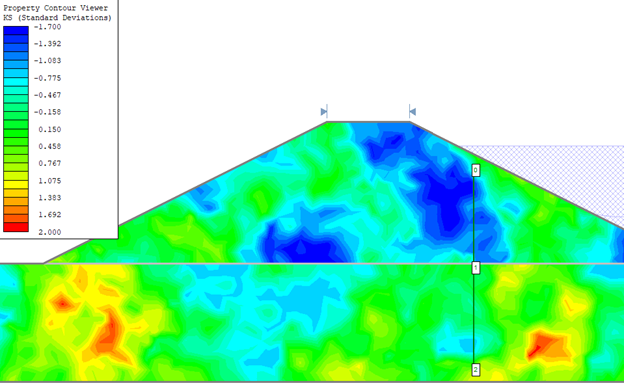
Like existing soil strength parameters, variations of soil hydraulic parameters may result in a change in the probability of failure, highlighting the need to potentially consider a probabilistic analysis.
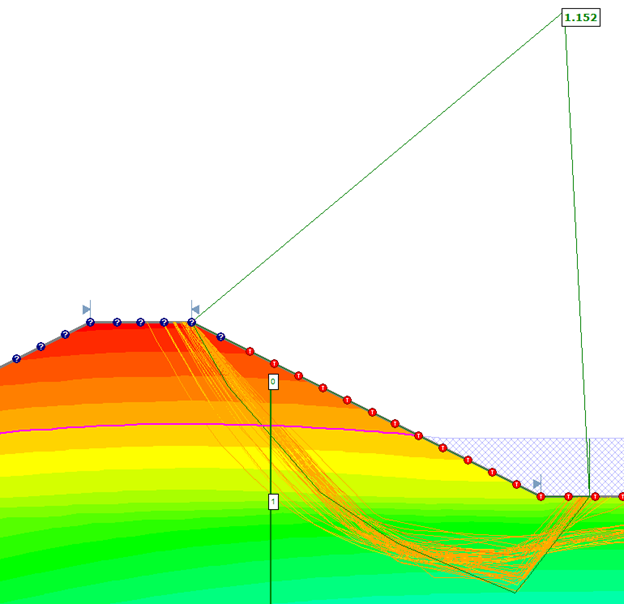
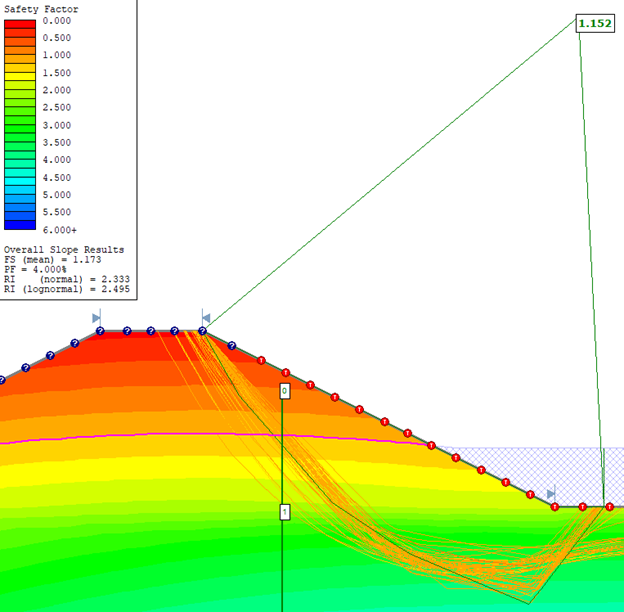
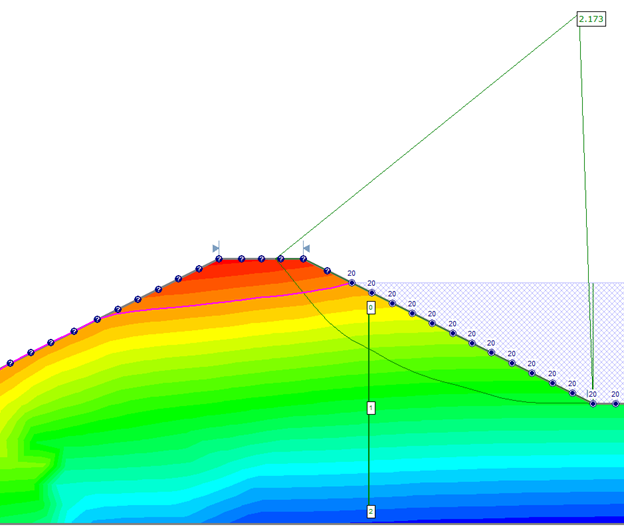
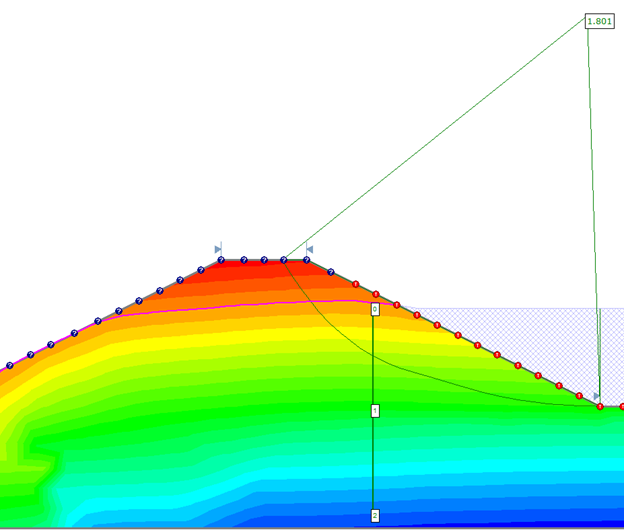
Using the property viewer, we can see the pore pressure results for each sample for each stage. For example, the below pore pressures are for the same sample as the previous figure at the initial stage, first stage, and the final stage respectively.
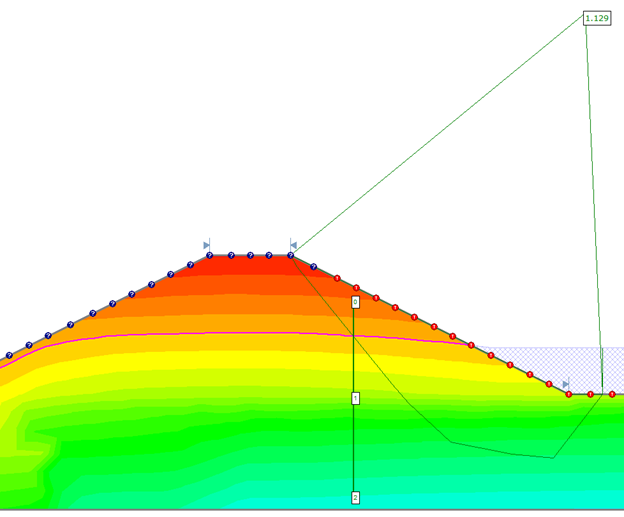
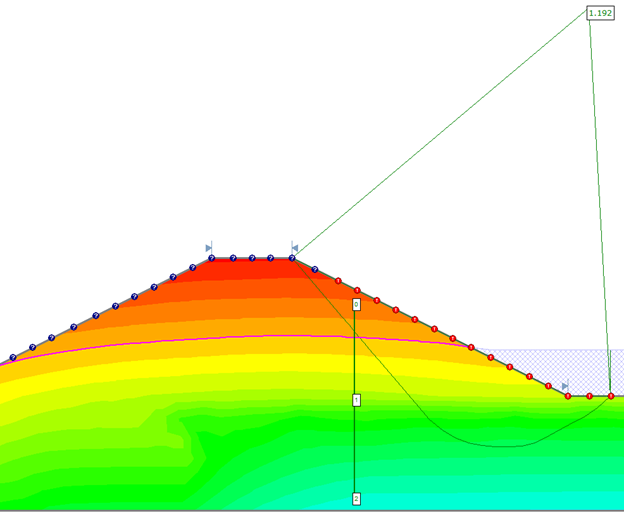
In comparison, the examples below are different samples at the final stage. Based on the resulting variation of pore pressures and the factors of safety between samples, a change in material permeability will have a noticeable effect on results.
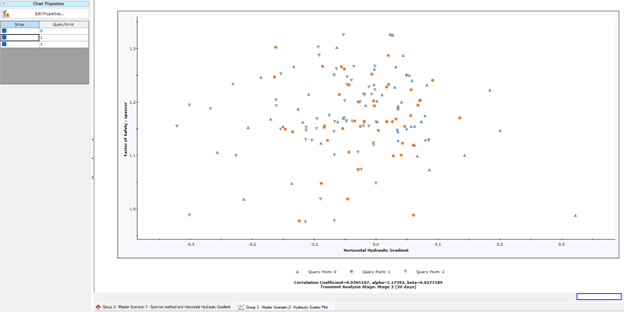
The Hydraulic Statistics Query is a new component of this feature that can be used to query groundwater result parameters (discharge velocity, hydraulic gradient, degree of saturation, etc.) which are normally available in the interpreter. The query can be added in the modeler under Properties >Hydraulics Query.
Then, we can view the data in interpreter under Statistics > Scatter Plot. For example, we want to know the horizontal hydraulic gradient at each point for each sample and plot it against the factor of safety for that sample. Before opening a scatter plot, we can set the Horizontal Axis as Horizontal Hydraulic Gradient and the Vertical Axis as Factor of Safety – Spencer. We see the following results:
We can further simplify data by turning off any samples we don’t want to see. The following image shows the horizontal hydraulic gradient values for the first query point for all samples.
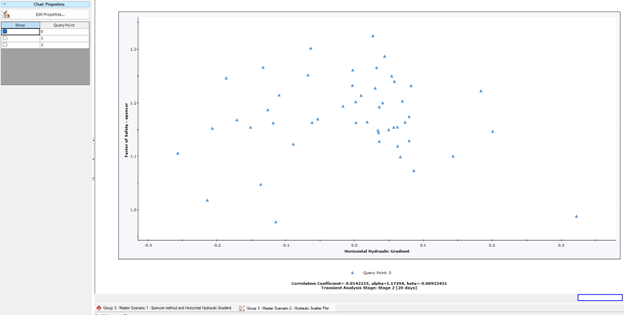
You can compare any available parameters with the factor of safety or other parameters using the scatter plot.
The below table compares the probabilistic results for the final stage for a deterministic, random, and spatial analysis respectively.
Deterministic |
Random – Overall Slope | Spatial |
|
Minimum FS |
1.15 |
1.08 | 0.98 |
PF |
N/A |
0.0% | 4.0% |
We hope you're as excited for Hydraulic Statistics as we are! This new feature, along with other Slide2 tools, will allow you to further enhance your probabilistic analyses and bring new insights when analyzing groundwater with finite element seepage analysis.
Experience the brand new Hydraulic Statistics feature in Slide2.
Start your free trial today!
Free Trial