RS3’s 3D Soil Structure Modeling of a Cofferdam for Cut & Cover Tunnel
Whether in a recently reclaimed land or a densely populated area, excavating on soft and heterogeneous soil can make it challenging to understand the ground response. This highlights the importance of geotechnical modeling paired with accurate data on ground response to achieve cost-effective construction designs.
This paper, which was presented at Rocscience International Conference 2021, discusses a simulation performed by creating 3D geometry and modeling soil-structure interactions using RS3, Rocscience’s 3D finite element program to fully understand ground response at different stages of excavation.
Simulation of a peanut-shaped cofferdam
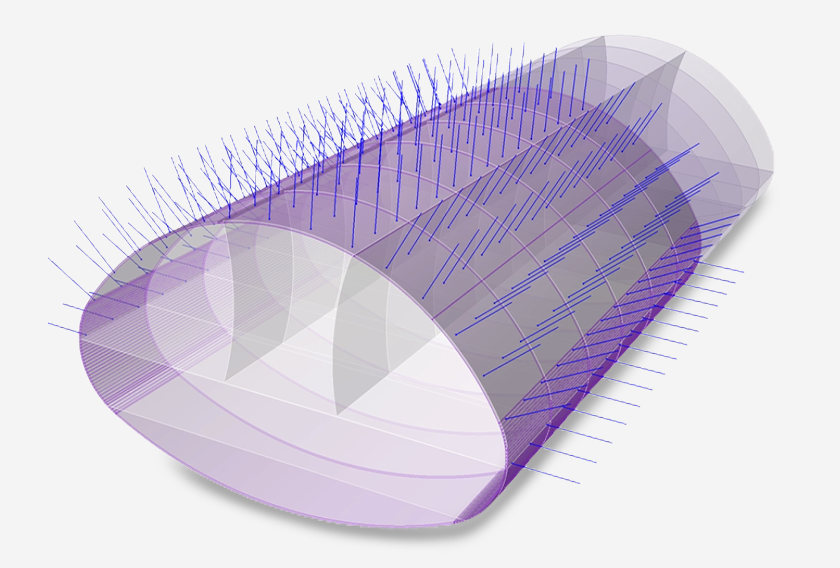
A cofferdam is often used as a support system as well as providing a dry underground workspace for engineers, constructors and their equipment to safely execute an array of construction projects. In this simulation, a peanut-shaped cofferdam is implemented during an excavation development of a cut and cover tunnel.
The cofferdam consists of 3 truncated circular cells – each cell is 21 m long, 22 m wide and connected. These cells are formed with perimeter D-wall panels that are merged to form an arc shape structure that can resist the lateral earth pressure by hoop forces.
The idea behind embedding the perimeter D-walls into the stiff ground is to maintain stability against base heave, piping, and failures.
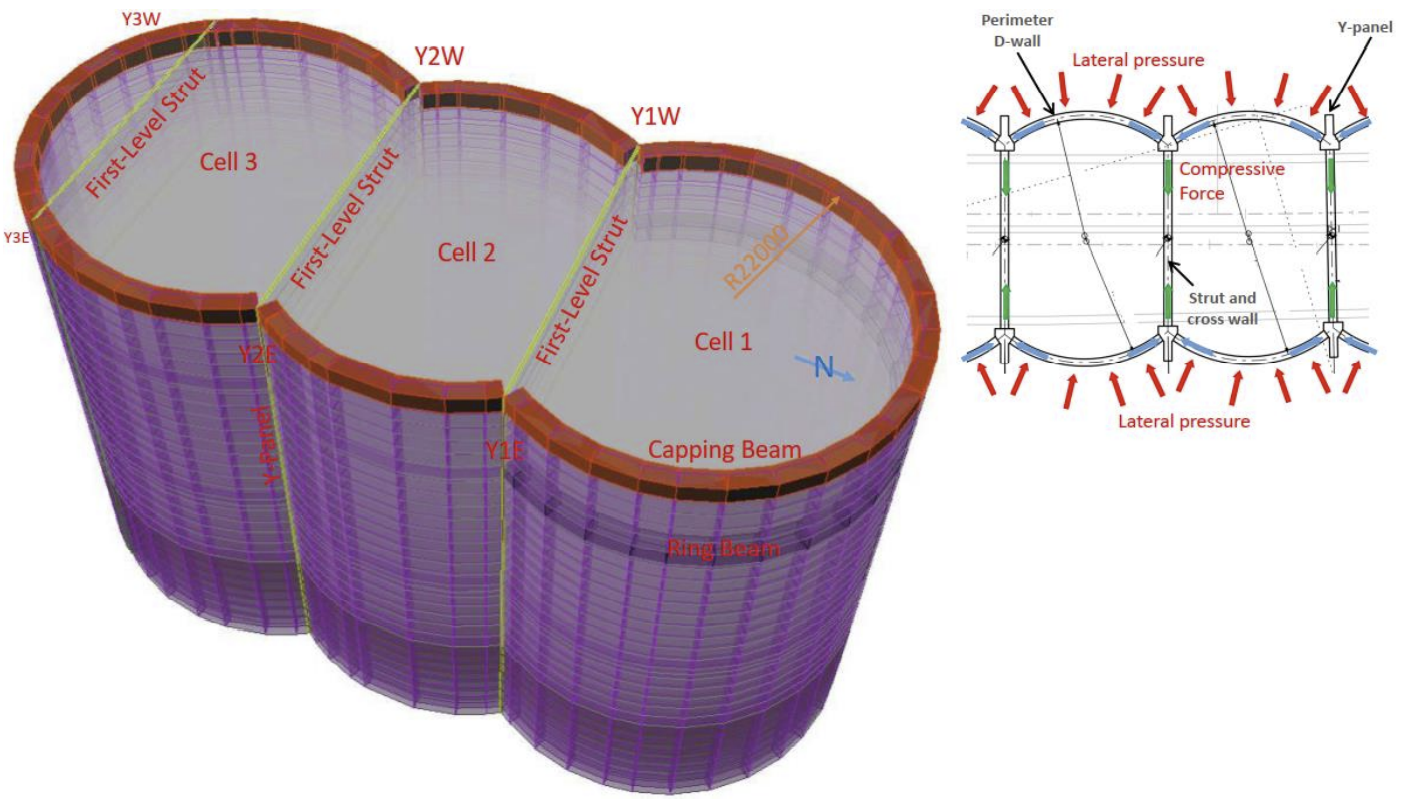
The implementation of a peanut-shaped cofferdam results in a much faster excavation as heavy steel struts, king posts, and water beams are excluded from this project. The cofferdam structure also omits the need for re-piping sequencing of multiple struts.
3D geometry of excavation development with RS3
Rocscience’s 3D finite element software RS3 is used in this simulation to model the construction sequences with basic soil properties and the findings are further illustrated in this study.
Table 1 details the construction sequences.
Stage |
Modeling Activities |
Stage |
Modeling Activities |
Stage |
Modeling Activities |
1 |
Assign elastic elements to generate in-situ stresses |
12 |
Install Strut in Fill and Ring Beam at – 7 mPD (Second-Level Strut) |
23 |
Excavate to- 27mPD |
2 |
Change from elastic to plastic element |
13 |
Excavate to -9 mPD |
24 |
Excavate to 29 mPD |
3 |
Install Y-Panel, D-wall, Capping Beam and Cross Wall |
14 |
Excavate to -11 mPD |
25 |
Excavate to-31 mPD |
4 |
Install Top Strut at +5.5 mPD (First- Level Strut) |
15 |
Excavate to-13 mPD |
26 |
Excavate to – 33 mPD |
5 |
Excavate to +3.5 mPD |
16 |
Excavate to - 15 mPD |
27 |
Excavate to – 35 mPD |
6 |
Excavate to + 1.5 mPD |
17 |
Excavate to – 17 mPD |
28 |
Excavate to – 37 mPD |
7 |
Excavate to -0.50 mPD |
18 |
Install Strut in MD at - 17 mPD (Third-Level strut) |
29 |
Excavate to Final Excavation Level (-37.5 mPD) |
8 |
Excavate to-2.5 mPD |
19 |
Excavate to-19 mPD |
30 |
Install Strut in Alluvial Clay at -17 mPD (forth-Level-Strut) |
9 |
Excavate to-6.5 mPD |
20 |
Excavate to-21 mPD |
31 |
Demolish Cross Wall |
10 |
Excavate to-6.5 mPD |
21 |
Excavate to-23 mPD |
||
11 |
Excavate to-7 mPD |
22 |
Excavate to-25 mPD |
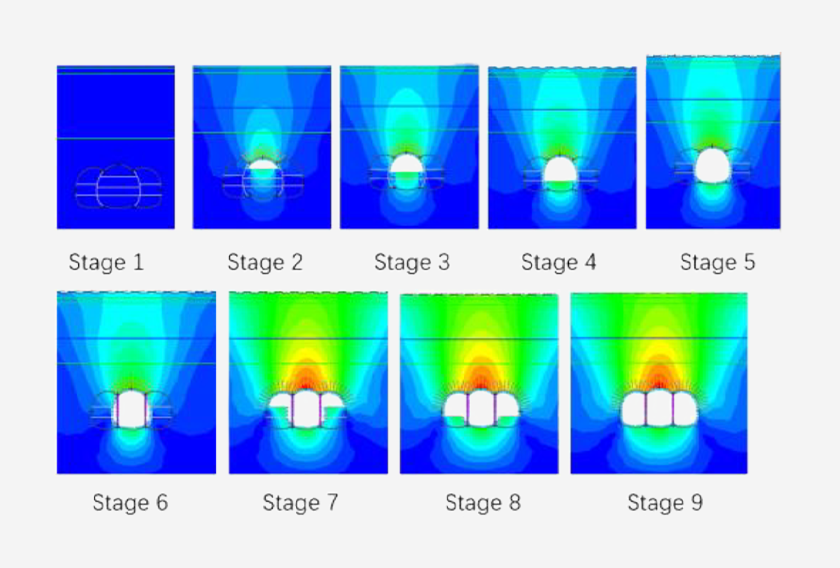
Overview of the construction stages
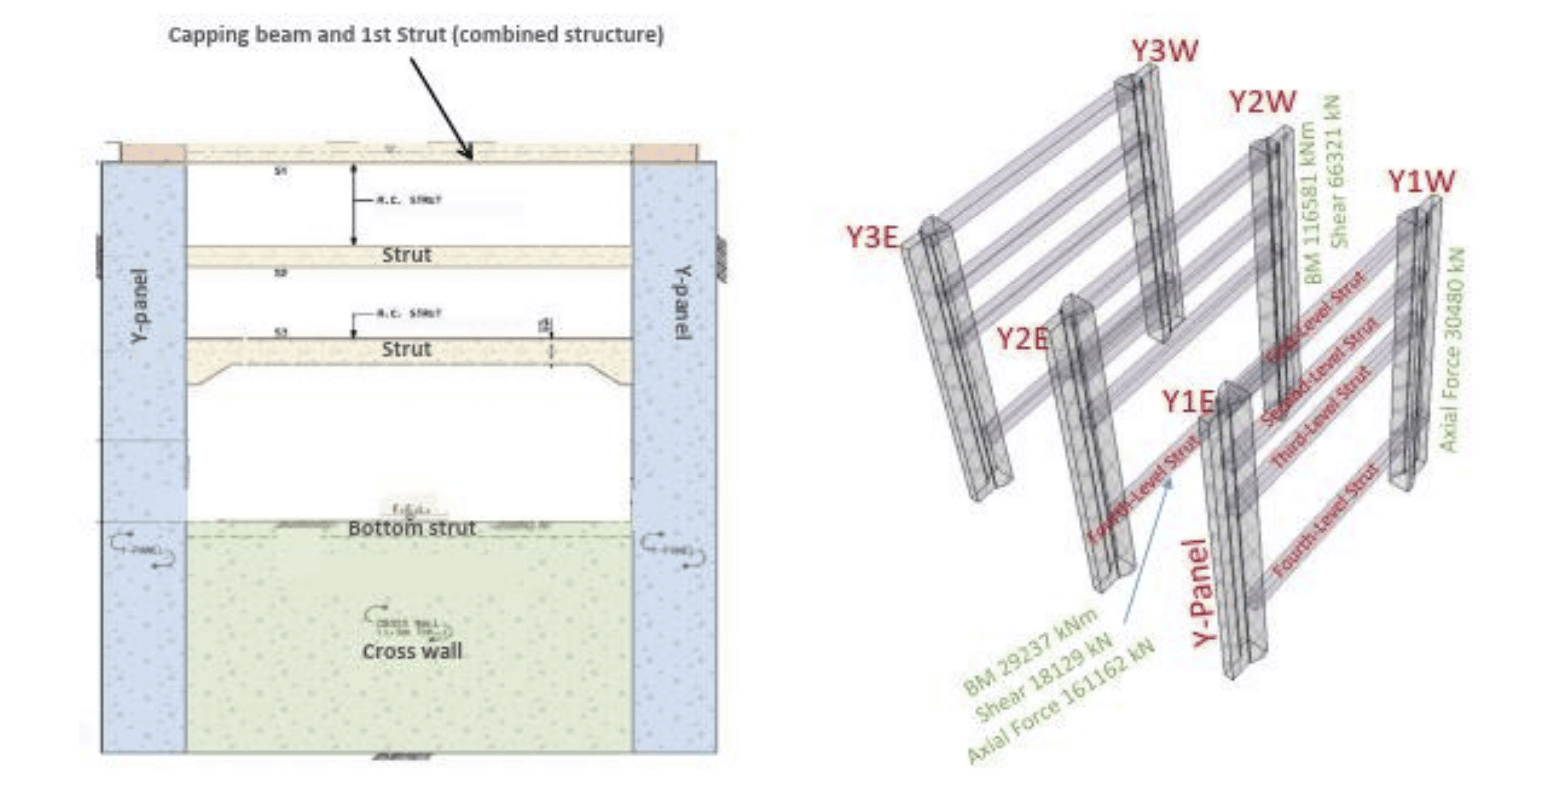
The first stage of this cut and cover method of tunnelling involves the capping beam, 1st layer of struts at ground level, the perimeter D-wall and the cross walls. Consecutively, the 2nd stage shows the installation of the 2nd layer of struts, followed by a ring beam at the 2nd strut level and excavation to the bottom level of the 3rd strut layer.
The 3rd stage of construction highlights the third strut layer and cross-walls, 8m above the final excavation level (FEL) at the Y-Panels location. In the 4th stage of construction, bottom struts are installed at FEL adjacent to the cross-walls that are supporting the Y-Panels. Further, cross-walls are collapsed down to the FEL during this final phase.
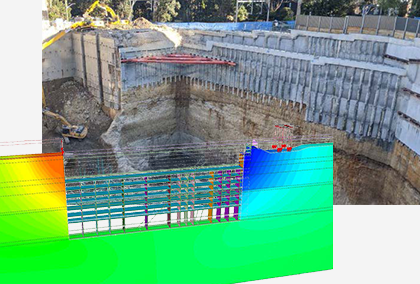
The structural alignment of the Y-panel along with struts and the cross-walls can be seen in Figure 2.
The Y-Panel and the struts are under a high bending moment measured as 117,000 kN-m and a high compressive force of about 160,000 kN.
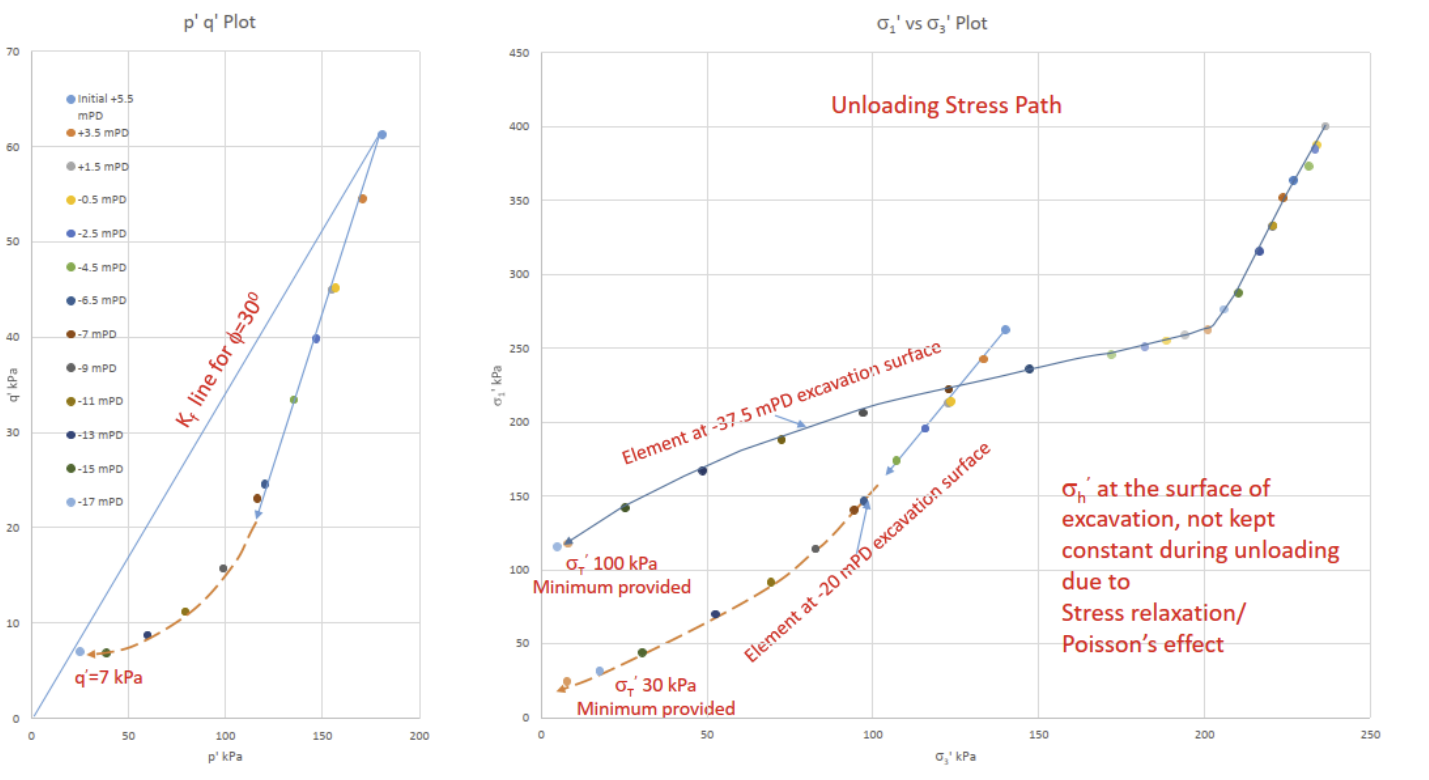
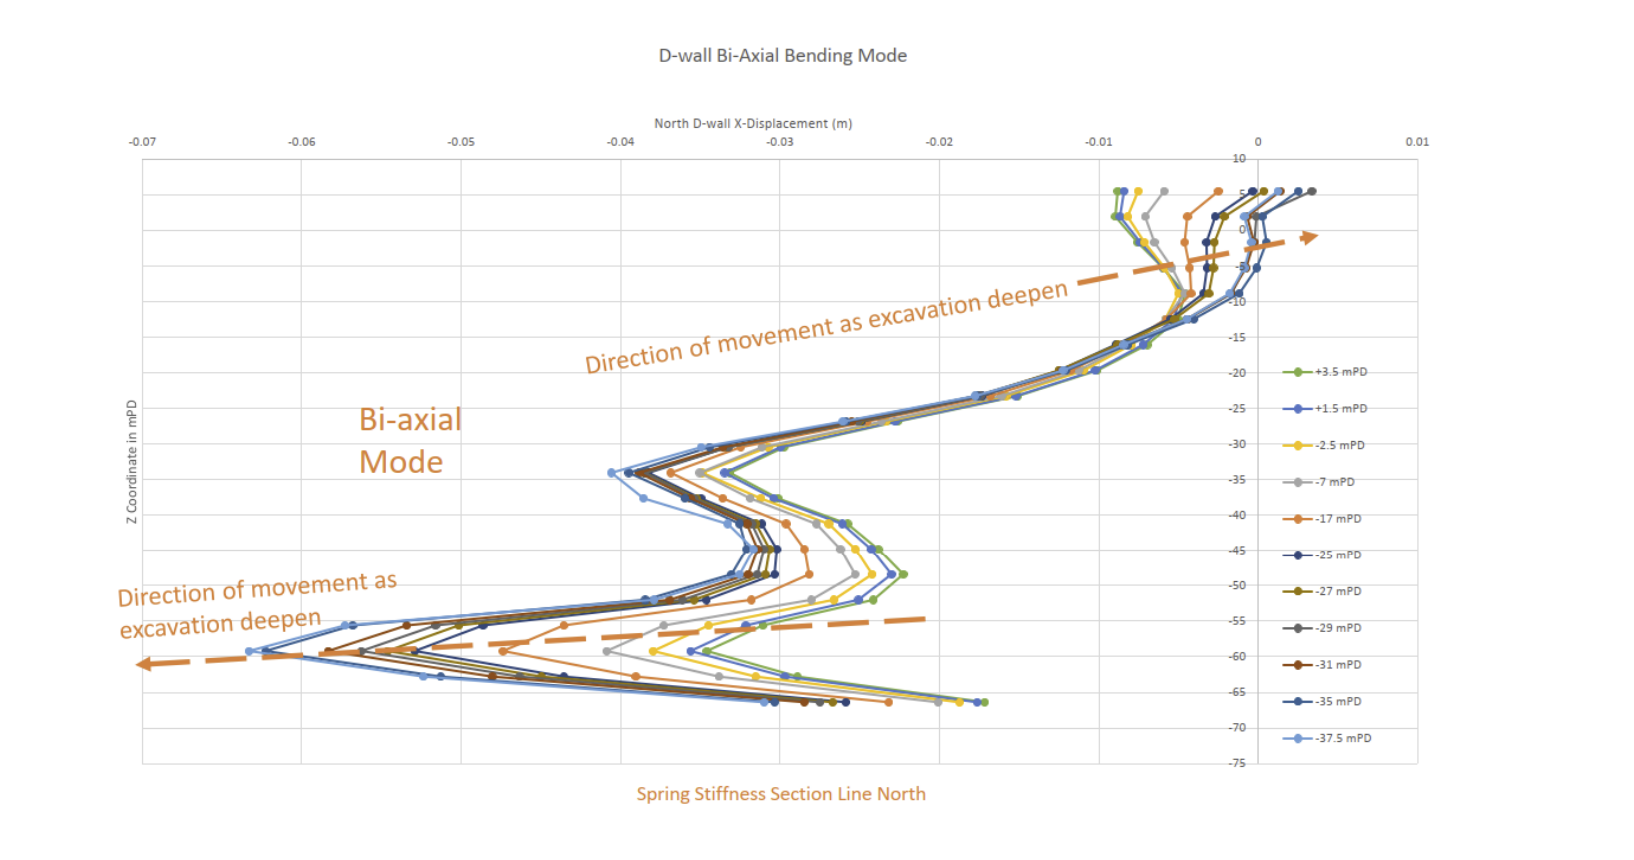
As the excavation deepens, the reduction of the vertical stresses does not remain constant in the unloading stages due to stress redistribution and interaction with the deformation of the D-wall panel.
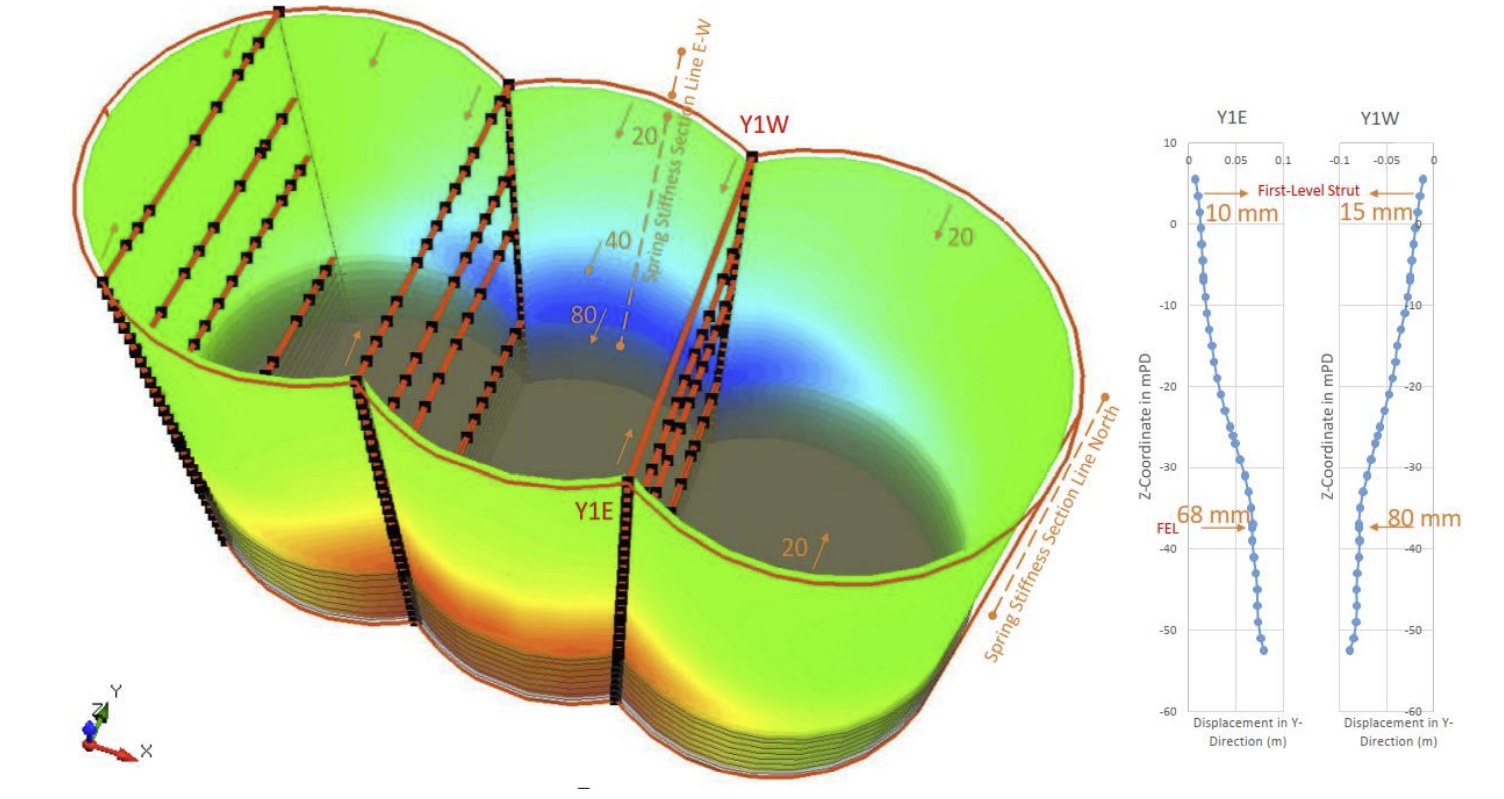
A comprehensive analysis of the deformation patterns of the depth of the D-wall in figure 5 displays how the upper and lower parts of the D-wall panel deflect away in opposite directions in bi-axial mode.
A traditional structural analysis follows a handbook (e.g., Geoguide 1, 2020) to represent geotechnical materials by ground stiffness for carrying out the design of structural components. However, this simulation adopts the 3D finite element method to analyze a sequence-based construction model and considers generic soil properties in the analysis and design of the structure.
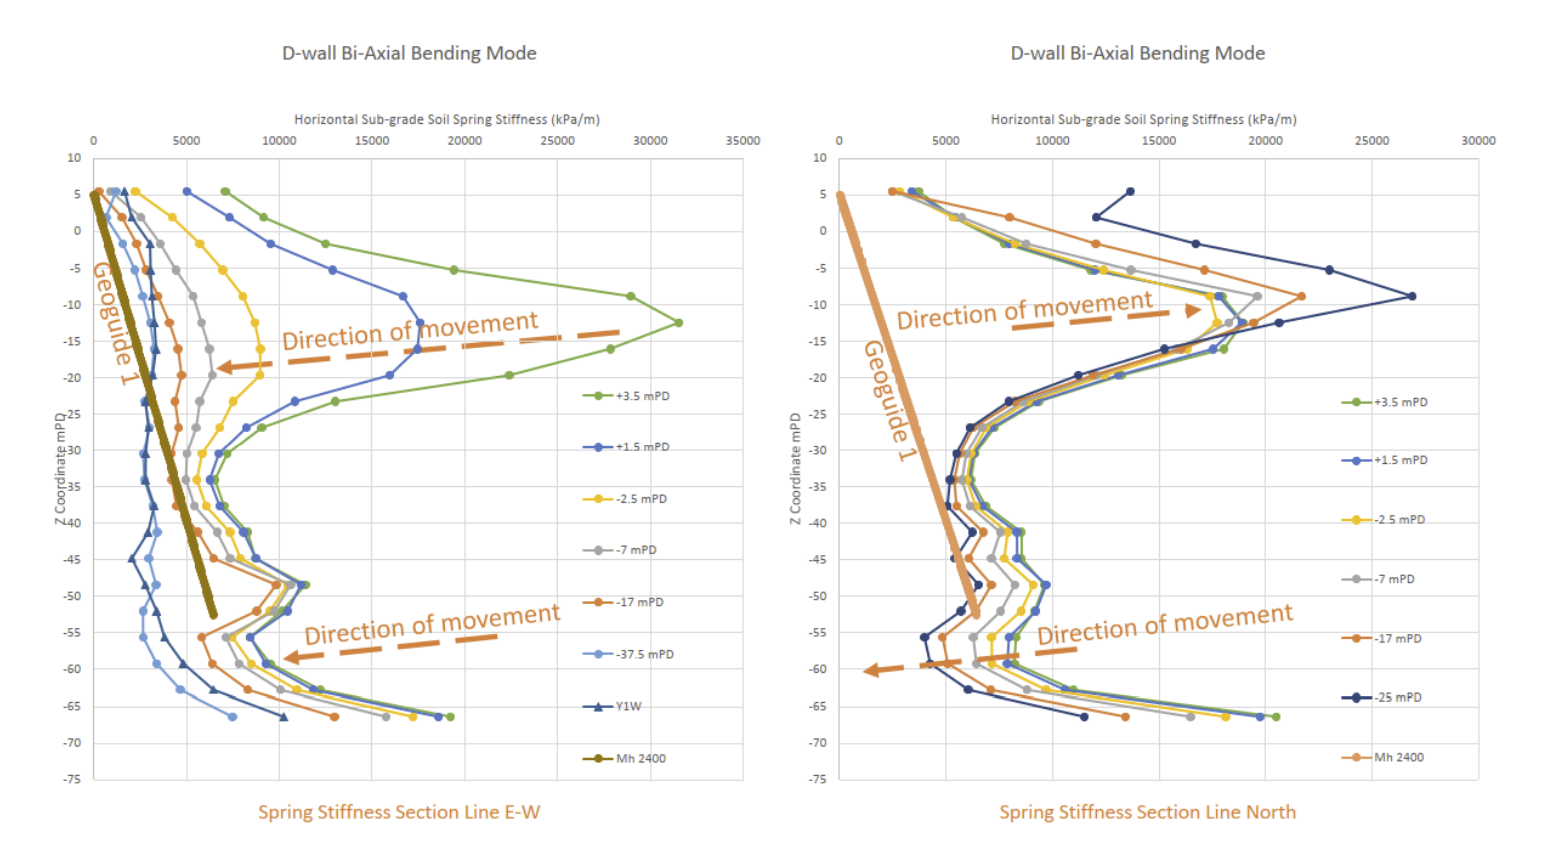
The ultimate discovery with RS3
The key lesson learned from RS3’s 3D analysis is that the soil spring stiffness is variable at different stages of excavation and unloading. It does not increase linearly with depth and its value is higher than the typical value a structural analysis may consider.