See Slide3 and RS3’s Powerful New Features in Action Together
- David Ko, Geotechnical Project Manager
- Cristian Salvalaggio, Software Developer
- Sina Moallemi, Geotechnical Product Manager
- Sina Javankhoshdel, Senior Manager - LEM
Rocscience’s industry-leading suite of tools is now even better with two new updates: Slide3’s Intelligent Search and RS3’s Hybrid Mesh. Here, we’ll use an open pit mine example to show you how these powerful features together can enhance your 3D slope stability analysis.
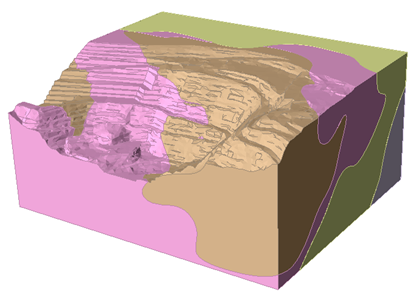
The pit consists of four rock layers, where the generalized Hoek-Brown constitutive model is used to describe the plastic behavior of the rock. Even though each program uses a different approach to find the stability of the pit, the factor of safety and the critical failure path results are very comparable between Slide3 and RS3.
Intelligent Search
Intelligent Search improves search coverage efficiently by algorithmically focusing on regions of interest to provide more model safety information than ever. An initial analysis is performed to help identify regions of the model likelier to fail; these are dubbed “regions of interest.”
Intelligent search proposed a new procedure for generating slip surfaces customized for the model being analyzed. By generating many of these custom surfaces we can refine our picture of the model. The model below shows a safety map visualizing the regions of interest after 10,000 preliminary surfaces.
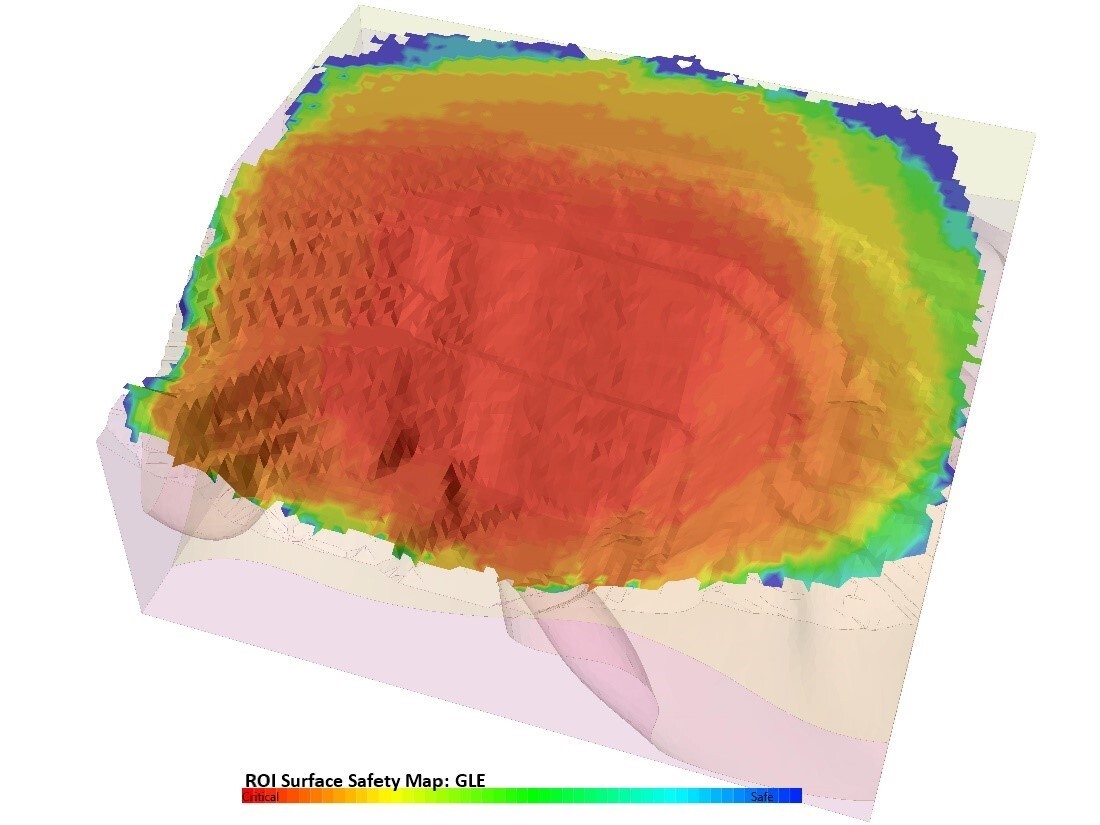
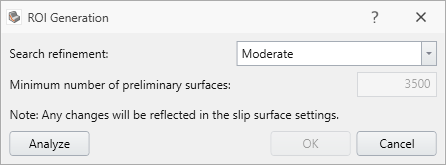
This regions of interest safety map can be generated when using Intelligent Search and can be generated independently of the complete search for rapid analysis. You can input the minimum number of preliminary surfaces to customize the safety map’s resolution.
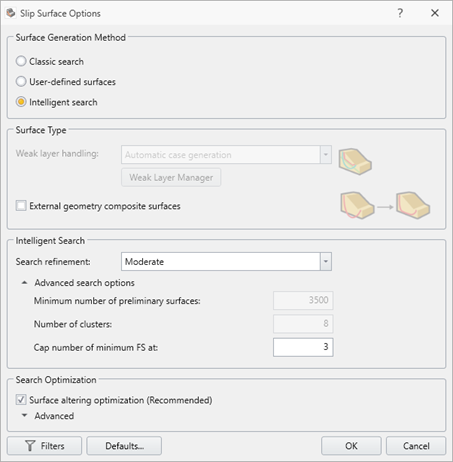
Then, the identified regions can be more thoroughly explored by performing several targeted particle swarm searches, which we call clusters (Figure 5). You can adjust the number of clusters by changing the search refinement to user-defined.
You’ll achieve better results quickly due to the information learned from the preliminary analysis, and you can identify multiple failure modes while keeping the search focused on important areas of the model. Then input the maximum number of failure modes to display upon completion of search.
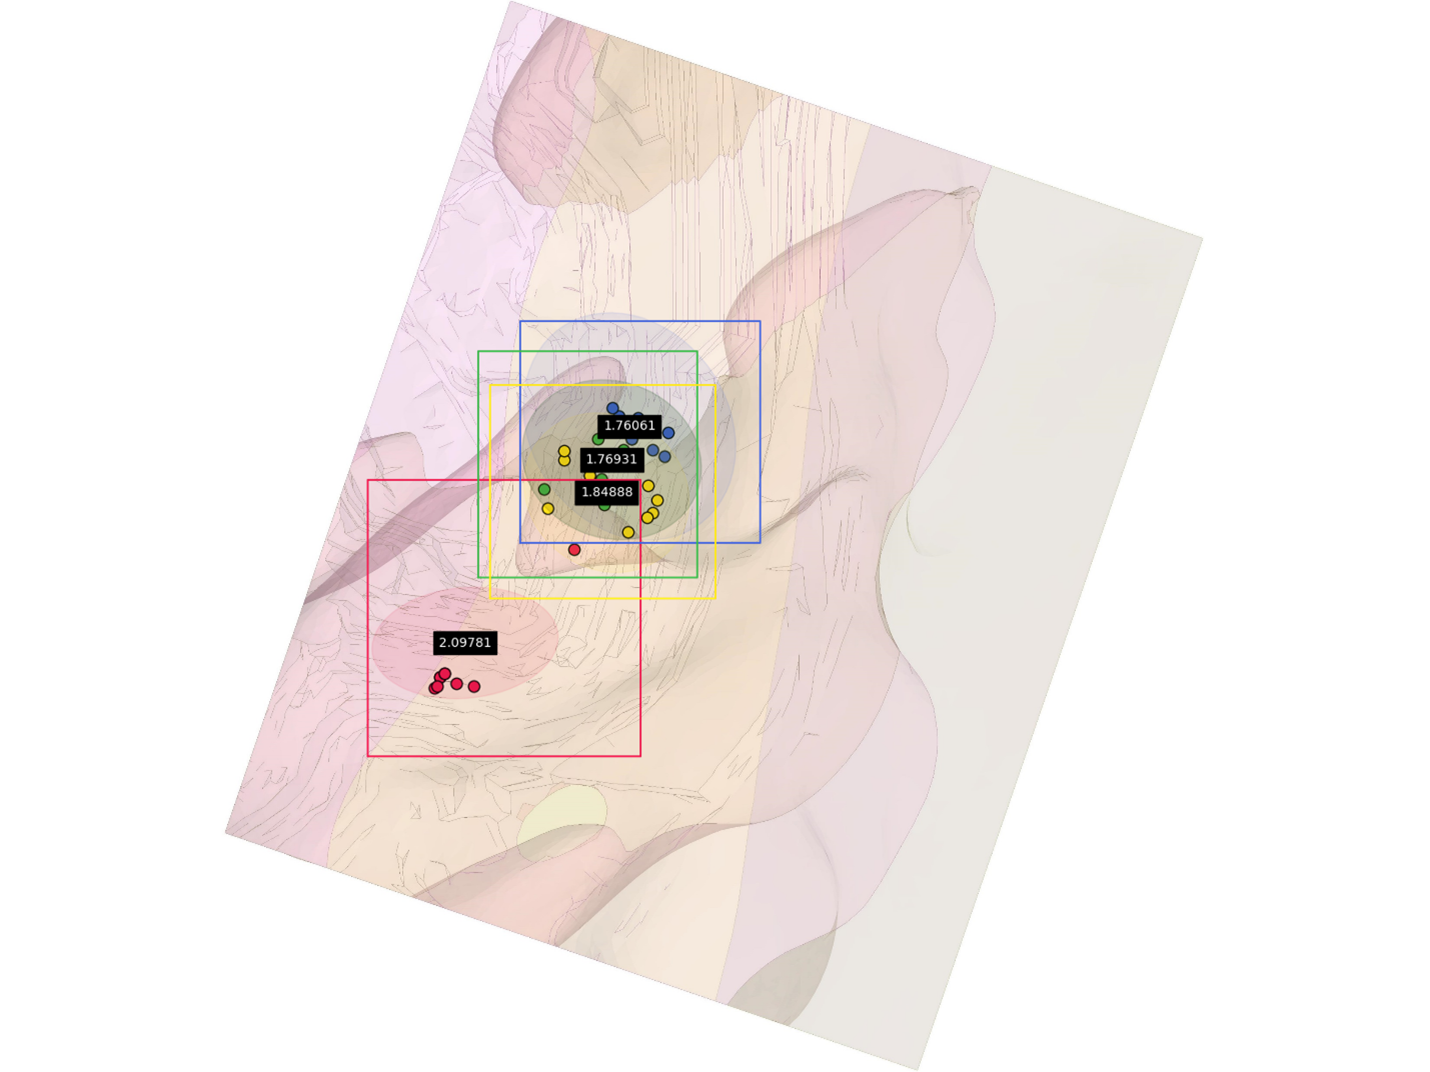
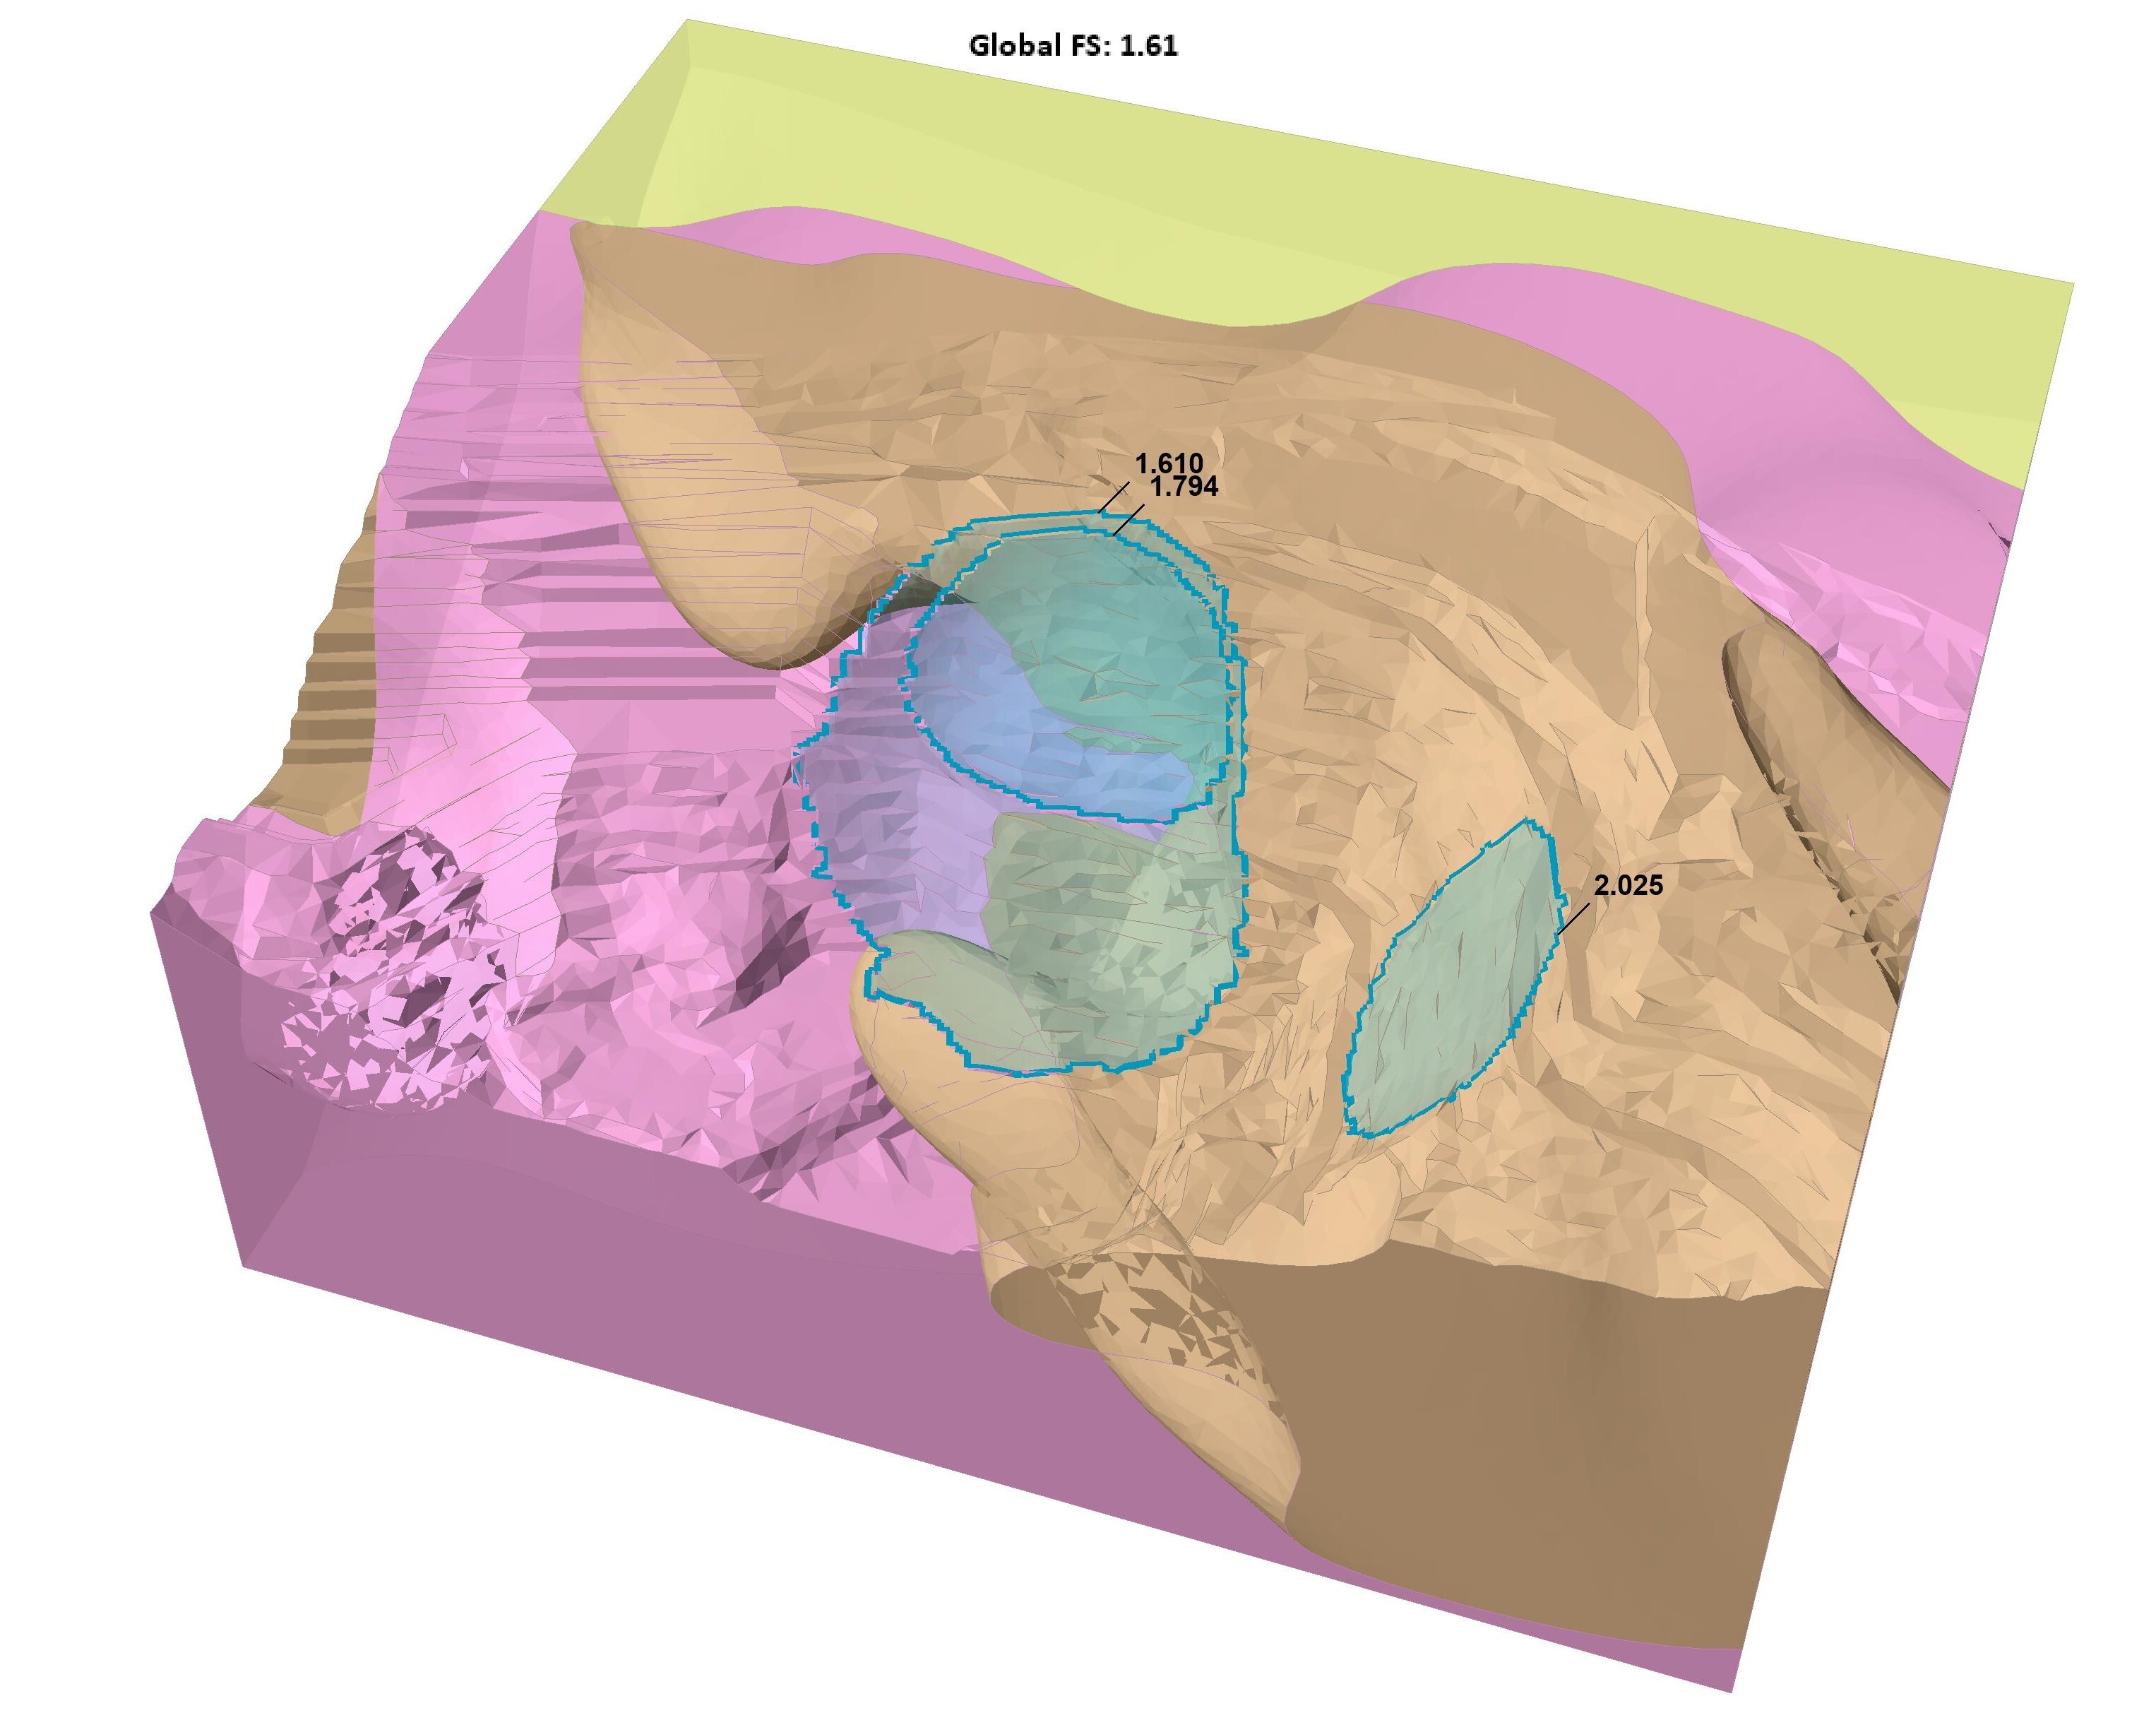
In our open pit mine example (see Figure 6), Intelligent Search identified three failure modes and a critical slip surface with a factor of safety of 1.61.
Hybrid Mesh
RS3 uses the 3D finite element method to analyze civil and mining geotechnical problems. When constructing a finite element model, meshing entails the spatial discretization of the domain into smaller elements to compute physical quantities such as stress, strain, and displacement within each element.
The element type directly impacts result accuracy and computation efficiency. Legacy versions of RS3 used to offer two types of elements; and they are 4-noded tetrahedron and 10-noded tetrahedron, representing different level of geometric/interpolation order. The quadratic shape function employed by 10-noded elements provides a higher level of result accuracy than the linear shape function employed by 4-noded elements. However, 10-noded elements take longer to compute.
RS3’s new Hybrid Mesh feature takes advantage of both element types to address these issues. With it, you can customize regions with different element types. You have a full control over which region(s) to focus on by strategically positioning areas meshed with higher-order elements within the model.
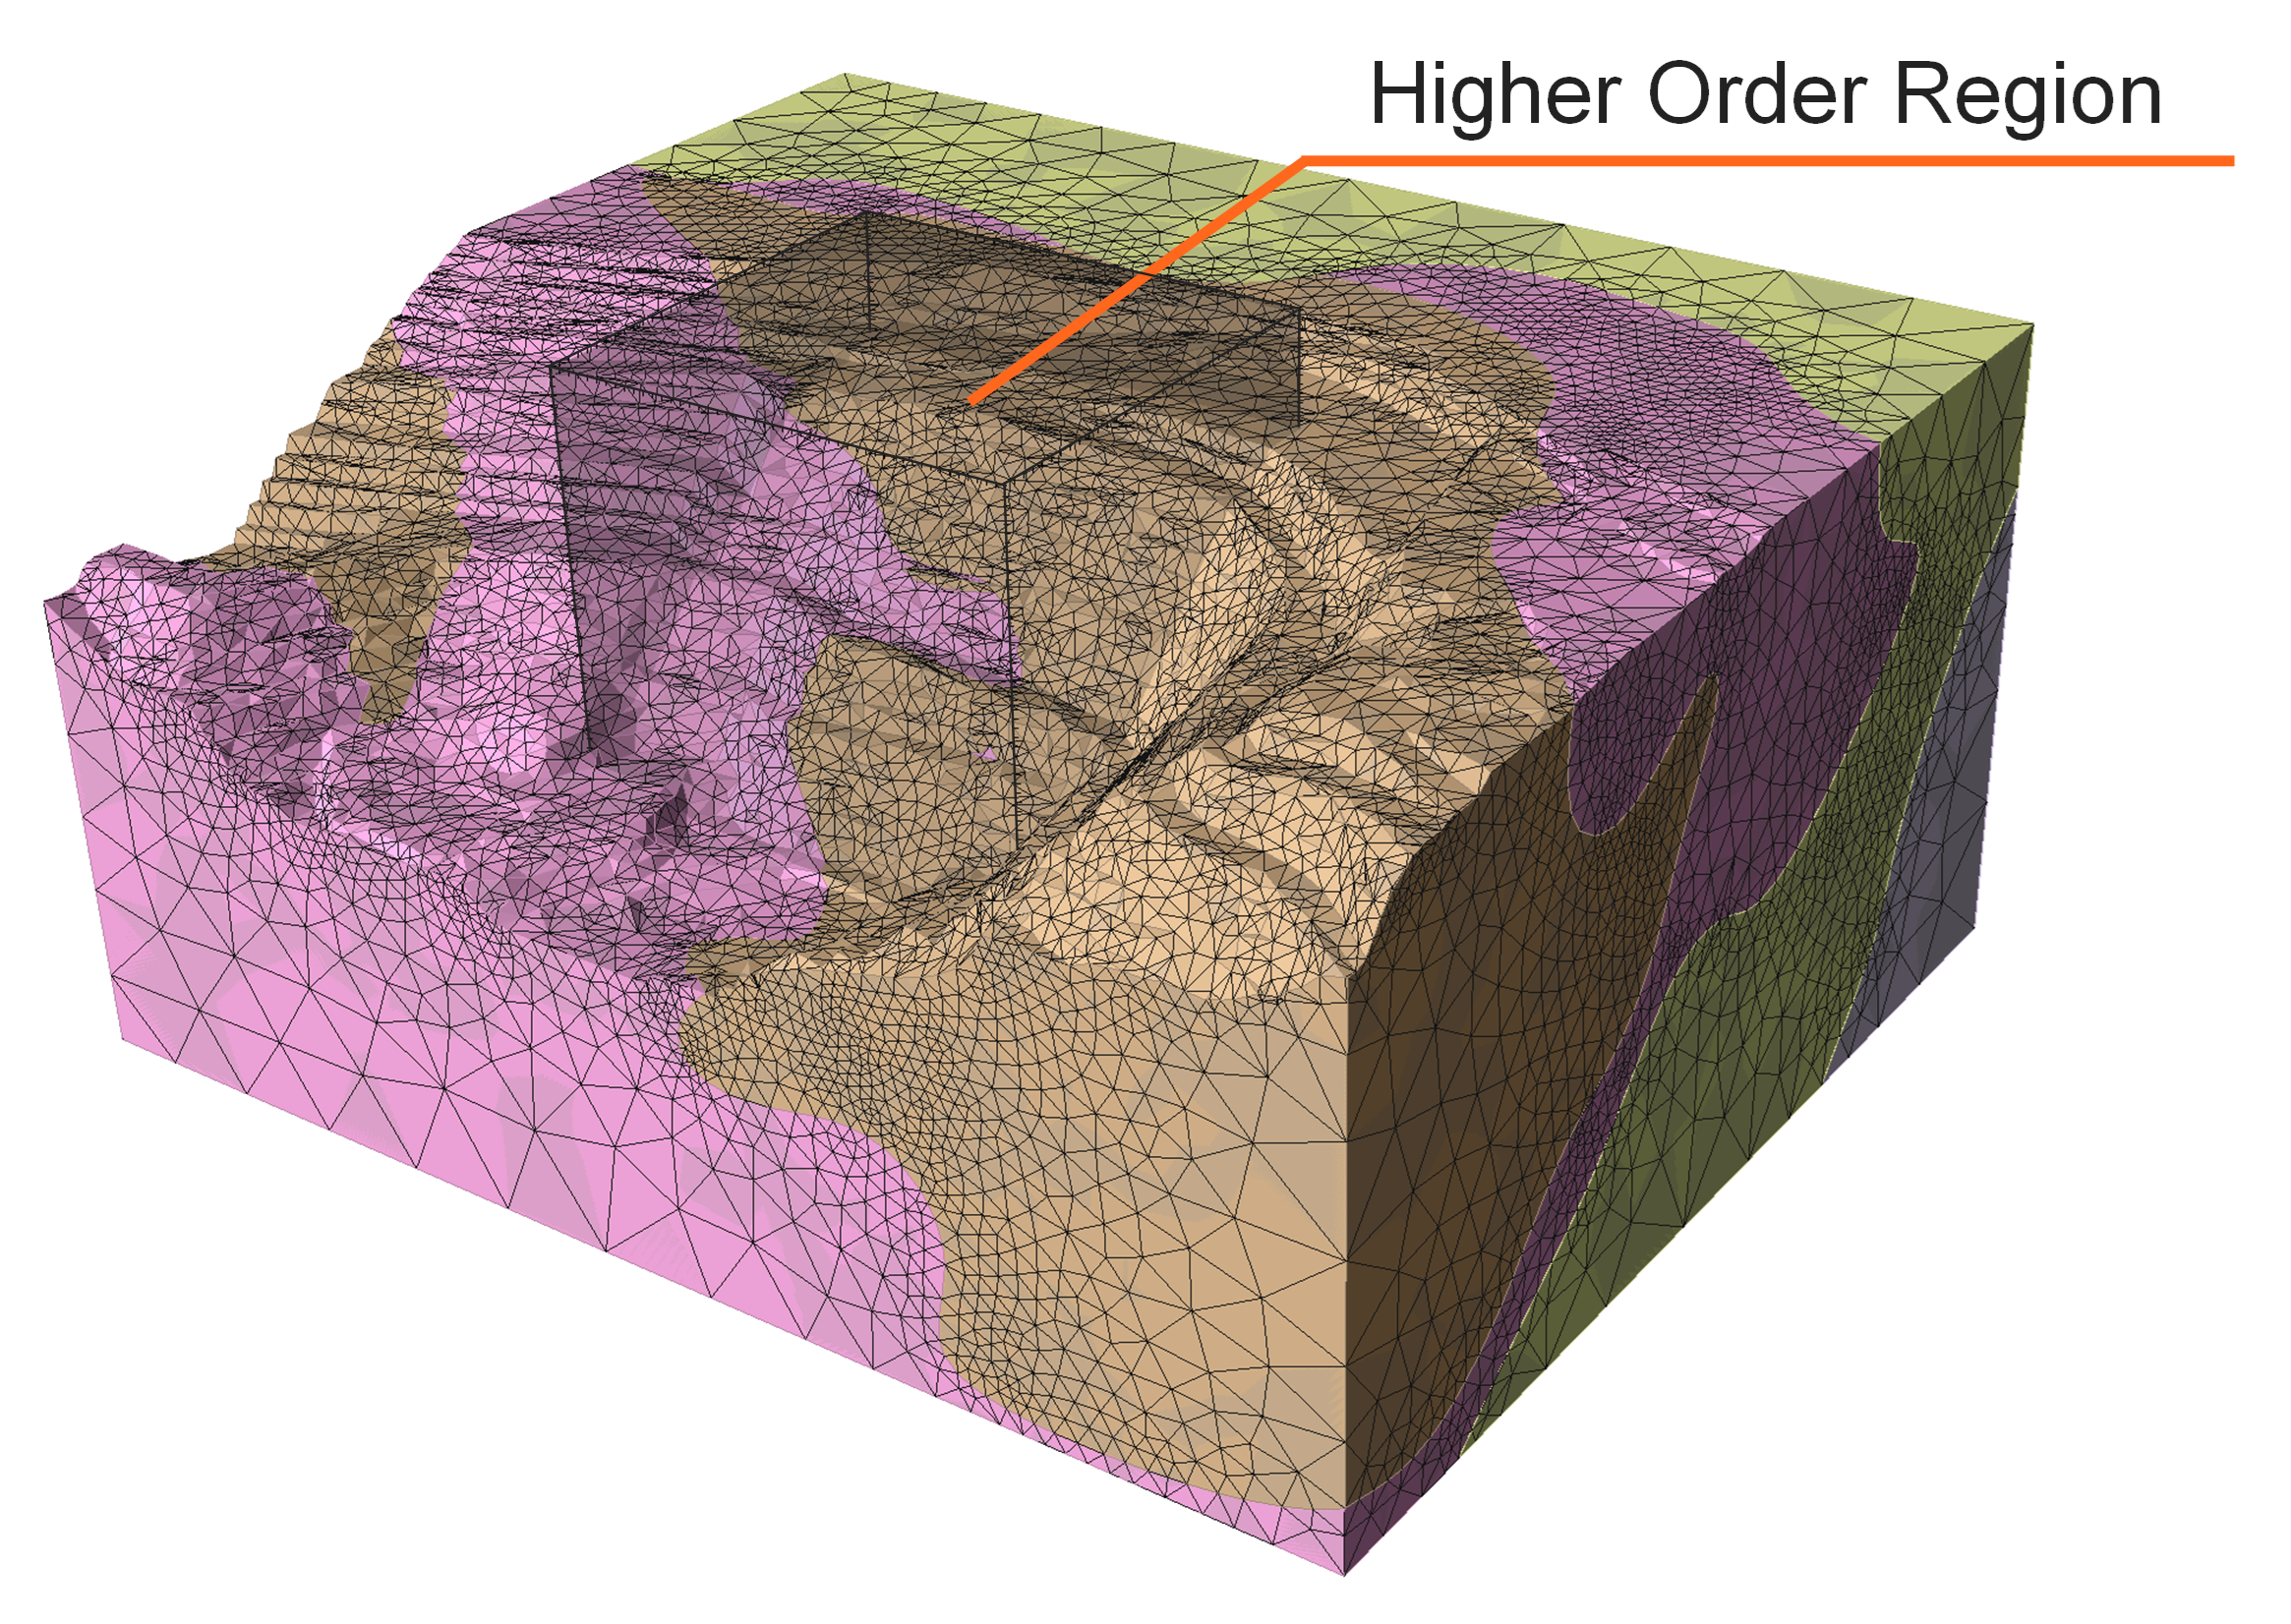
A numerical investigation was undertaken on our open pit mine example to evaluate the performance of three different meshing approaches, i.e. 4-noded, 10-noded, and mixed (hybrid) on the open pit described in previous section. The Strength Reduction (SSR) analysis was performed to calculate for the quantitative measure of slope stability, given by Strength Reduction Factor (SRF), which is a comparable parameter to the Factor of Safety (FS) in Slide3. As shown in Figure 7, the higher order region is placed, covering the failure region from Slide3.
A comprehensive overview of the test cases, computational efficiency metrics, and outcomes for each case is provided in Table 1. The total SSR analysis in the 4-noded case took approximately 9 times less than that of 10-noded case, which is a considerable difference in the total computation time.
However, the expedited computation comes at the cost of reduced accuracy, as the 4-noded case had a critical SRF approximately 11% higher than 10-noded case.
The hybrid mesh case offered the best of both worlds; the analysis time was only twice that of the 4-noded case, and it achieved a critical SRF identical to that of the 10-noded case, effectively balancing computational efficiency with result accuracy.
You can also see the total displacement plot that shows the concentrated region of deformation in Figure 8.
Table 1 - Modeling Results of Finite Element Analysis with Different Mesh Types
Case |
Number of Elements |
Number of DoFs | Number of SSR Iterations |
Total Time |
Normalized Time | Critical SRF |
4-noded |
287,076 |
150,782 | 9 |
17m: 20s |
1 |
1.79 |
10-noded |
287,076 |
1,178,246 | 8 |
2hr: 34m: 36s |
9.16 |
1.61 |
Hybrid |
287,076 |
150,782 | 8 |
29m: 51s |
1.79 |
1.61 |
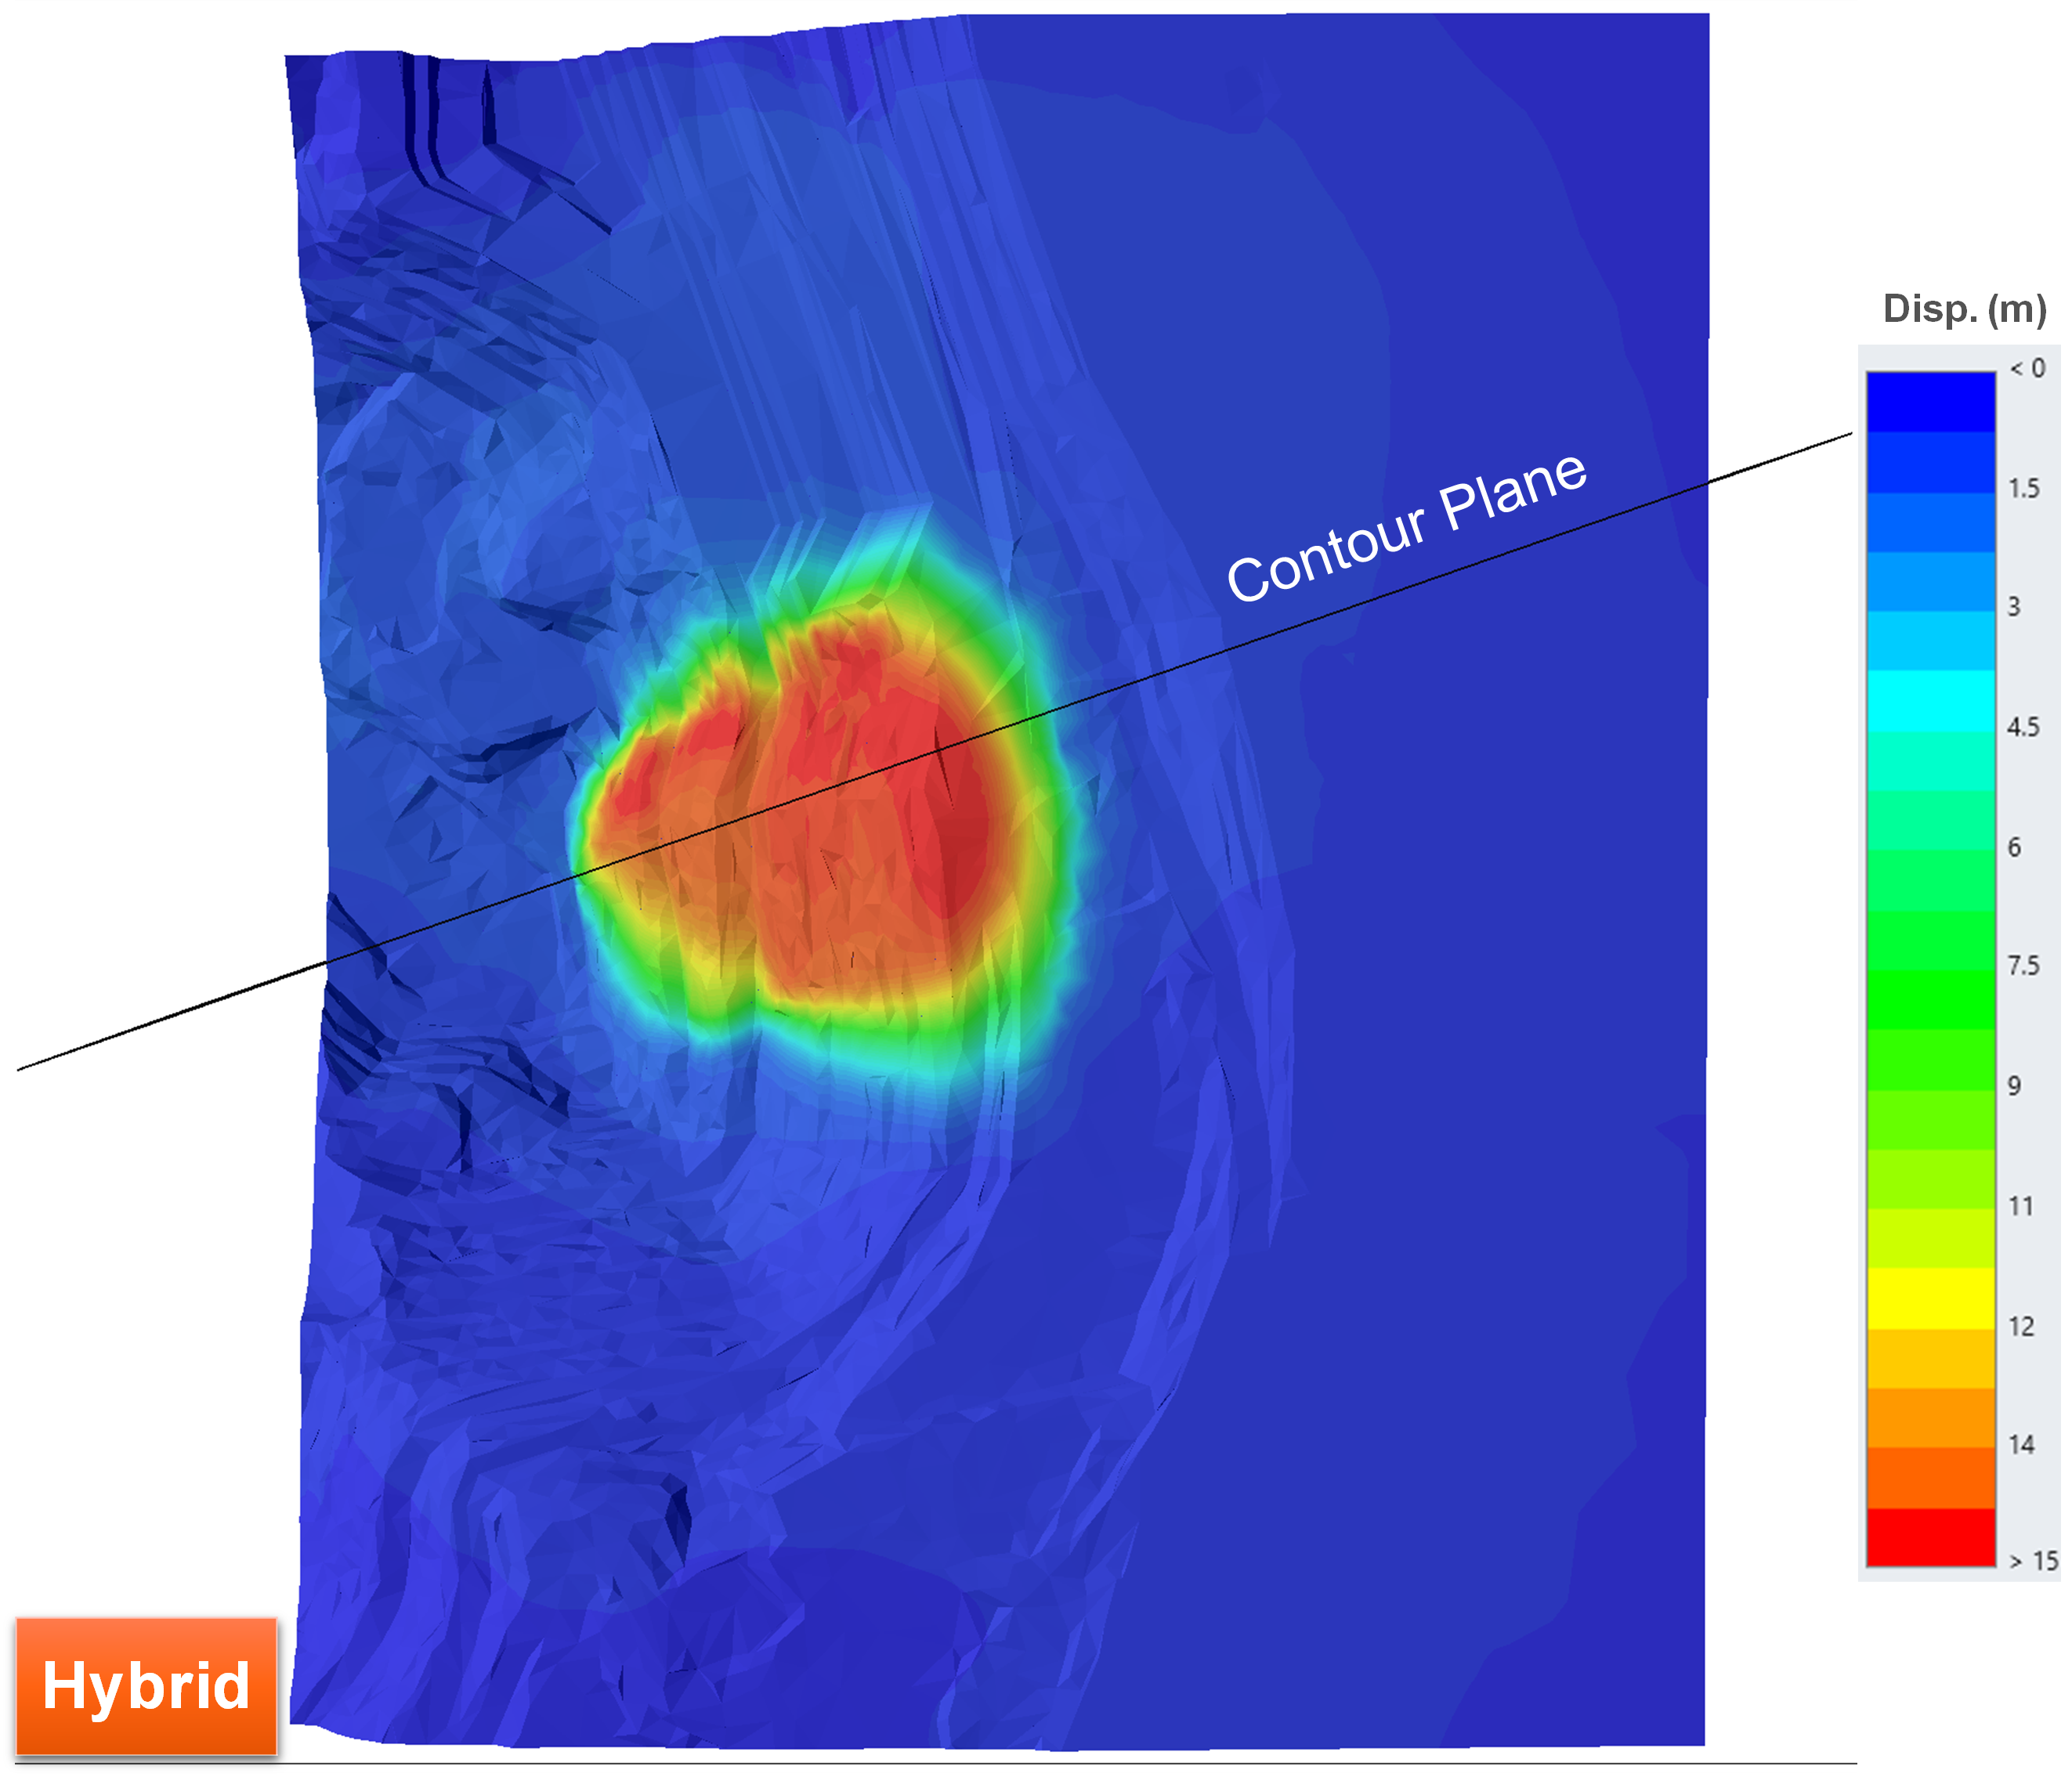
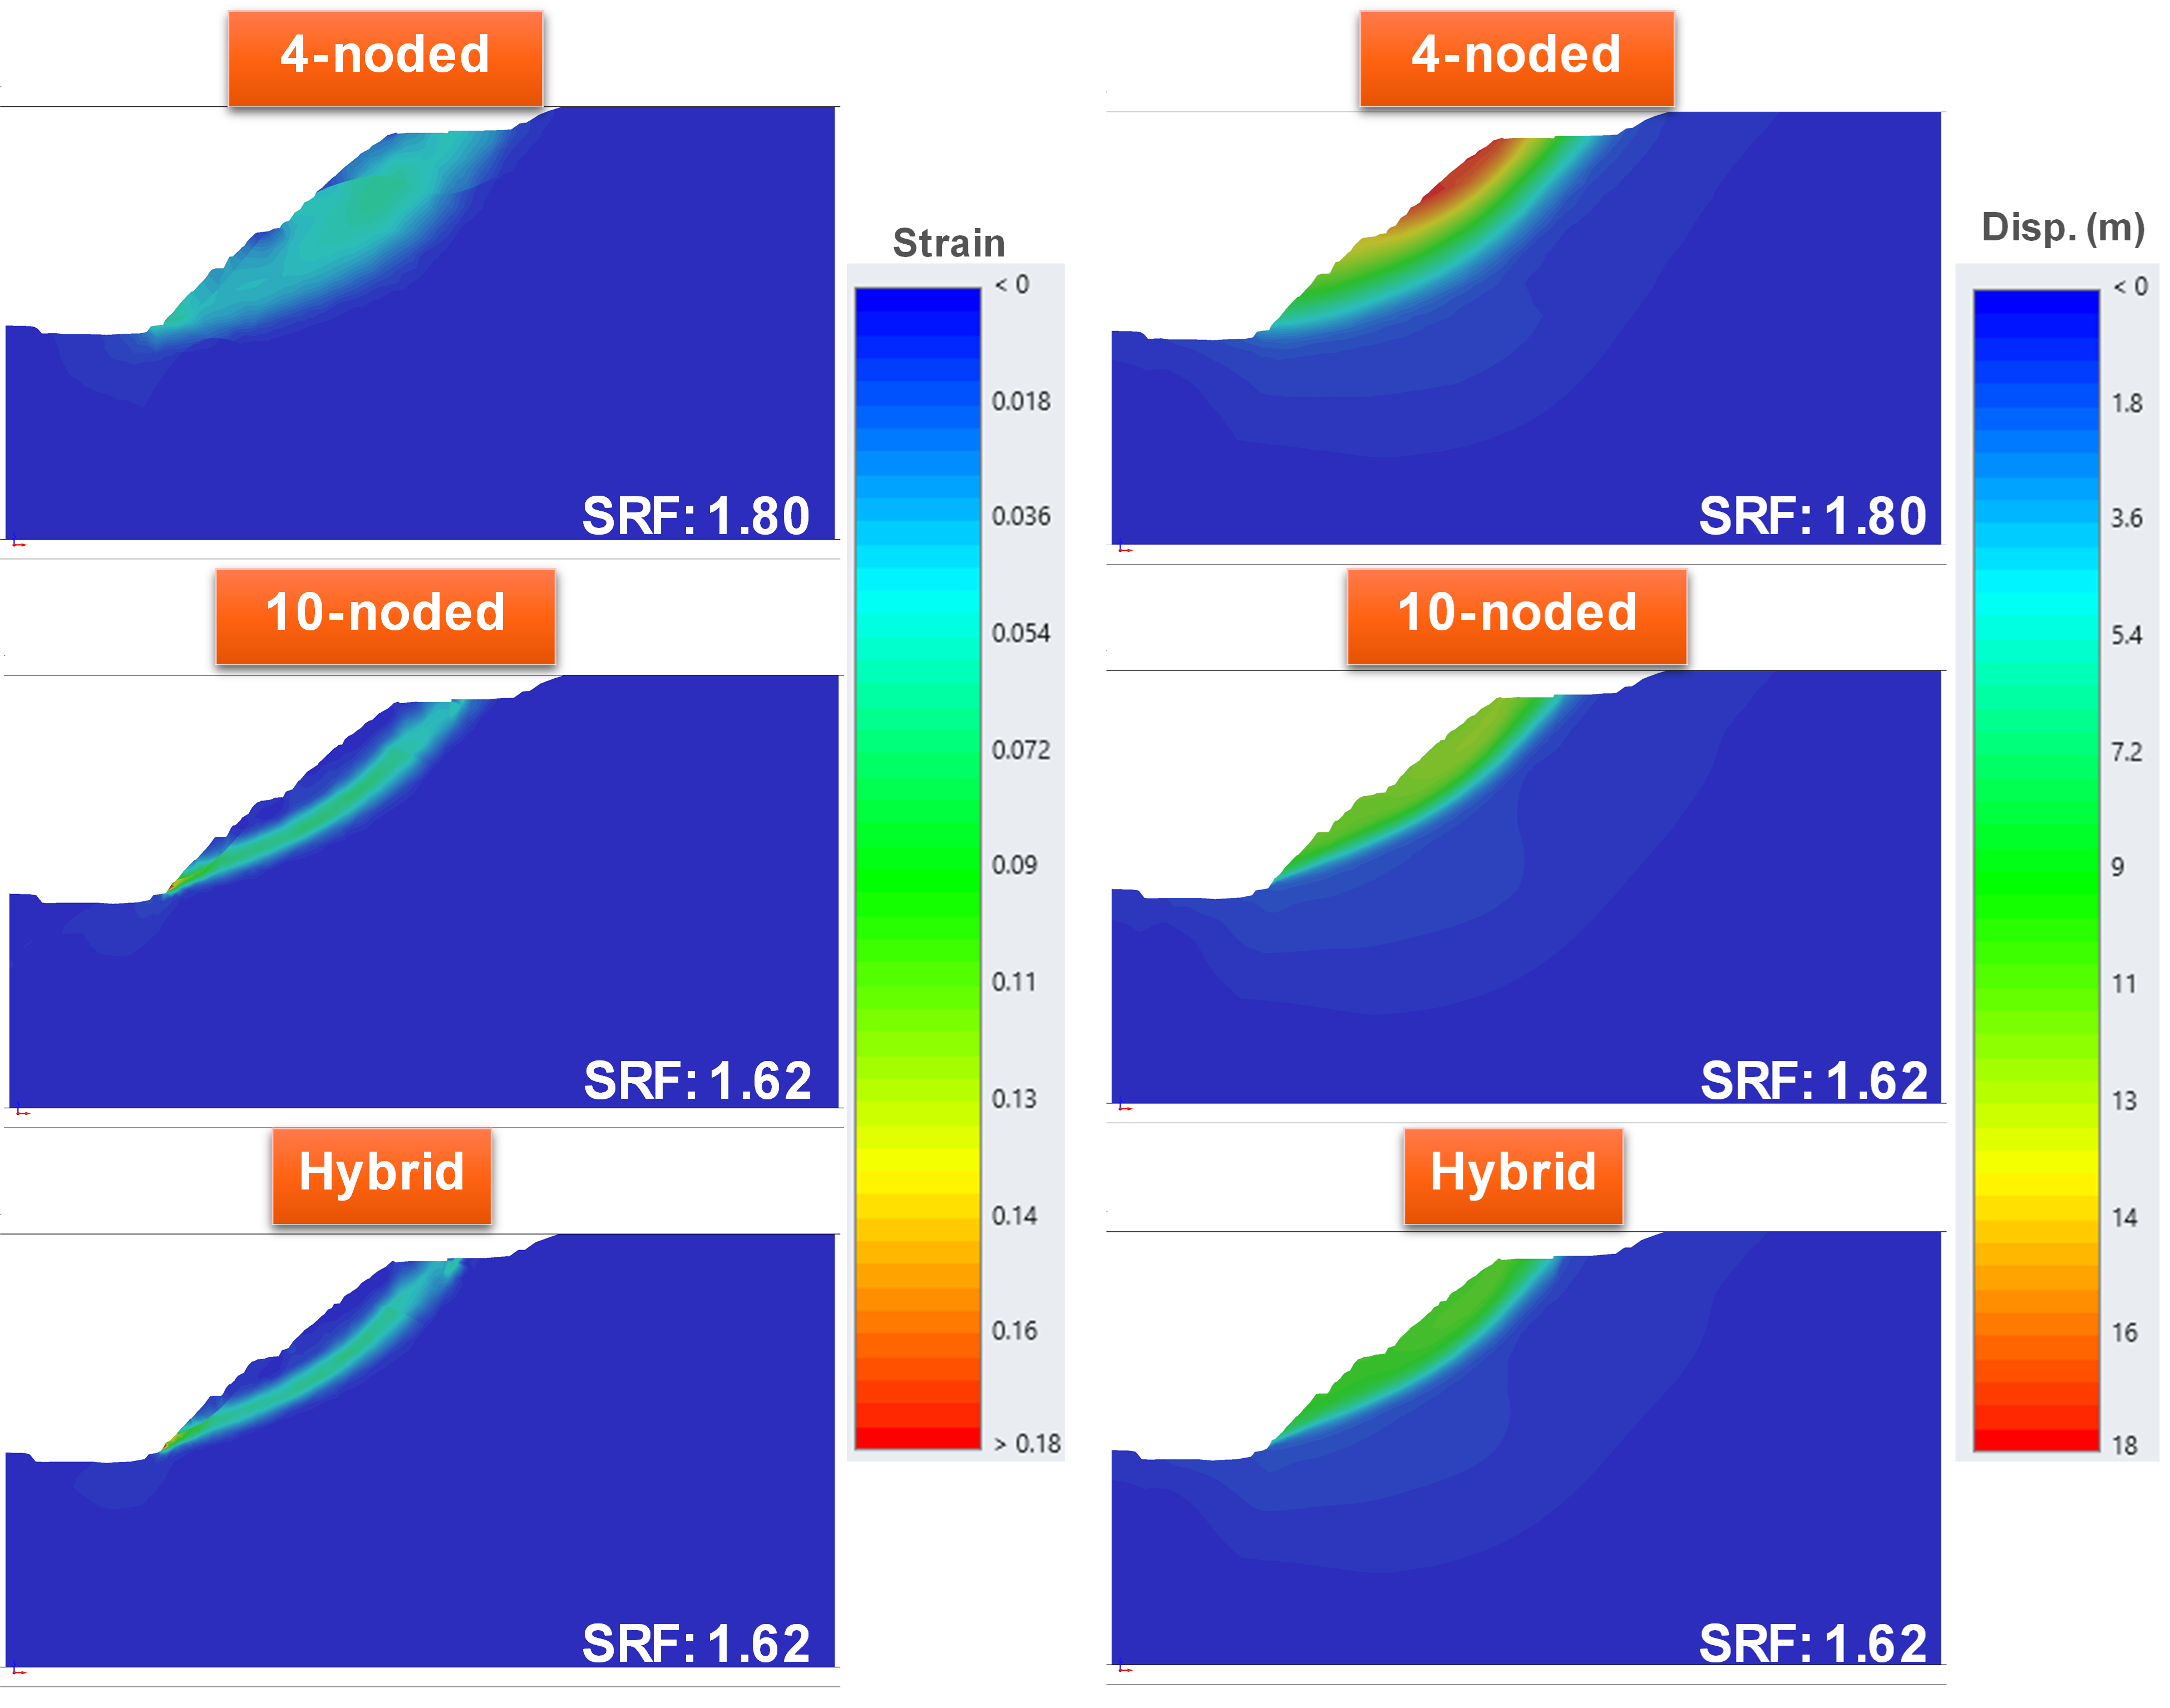
The shear strain and displacement data were captured to validate the improved accuracy in mechanical behaviour of the hybrid case (Figure 9). The contour plots clearly show that the hybrid case aligns closely with the 10-noded case results.
Moreover, the hybrid case is in strong concordance with the limit equilibrium analysis results obtained using Slide3’s Intelligent Search (Figure 6). The correlation was not limited to the stability factor (FS and critical SRF) but extended to the symmetry of the sliding surface, its location, scale, and the driving failure mechanism.
We hope that this article gave you helpful insight into Slide3 and RS3’s latest features, and that you’ll use them successfully in your projects. To learn more about our software, check out the learning resources section for Slide3 and RS3, or contact us here.